
September 2026 - Monthly Market Update
/Monthly Update || September 2026
“You need a certain amount of intelligence, but it’s wasted over a certain level. After that, it’s more intuition.”
Opening Remarks
Greetings from Ikigai Asset Management¹. We welcome the opportunity to bring to you our ninety-sixth Monthly Update and hope these are helpful in better understanding some of what we’re doing and what we’re seeing. We have the privilege of deploying capital on behalf of our investors into new technologies that have tremendous potential to make the world a better place and create trillions of dollars of value in the process.
We believe, in some cases, that we are obligated to be shepherds of some of these technologies – to do our little part to push ideas towards fulfilling their potential. We strive to be an objective, reasonable, well-intentioned voice of truth amongst a chorus of biased, fallacious, pernicious opportunists. It’s an honor that we take seriously.
To that end, crypto prices were up a LOT in August, even though not all that much happened with crypto in August. We’ll go into more detail on that in a bit, but for now the headline August numbers are big – BTC +25%, ETH +33%, SOL +42%.
AI Value Chain (“AIVC”) stocks mostly had a nice bounce after the big July Korea + Leopold selloff. QQQ is currently ~5% off ATH with SPX making new ATHs in August. Pretty much all of AIVC bounced REALLY hard on the Leopold news - but that bounce topped out mid-August. The last couple weeks AIVC has been consolidating, with a lot of names giving back most of their Leopold bounce.
Hyperscaler and AIVC earnings season is now mostly complete, and it was largely constructive for both the Hyperscalers and AIVC stocks. It’s hard to tie much of August’s AIVC price action to the fundamentals, because we had an ENORMOUS blowup in July with very significant ripple effects into price action across the entire space. But from a fundamentals perspective, the situation broadly got better with this earnings season.
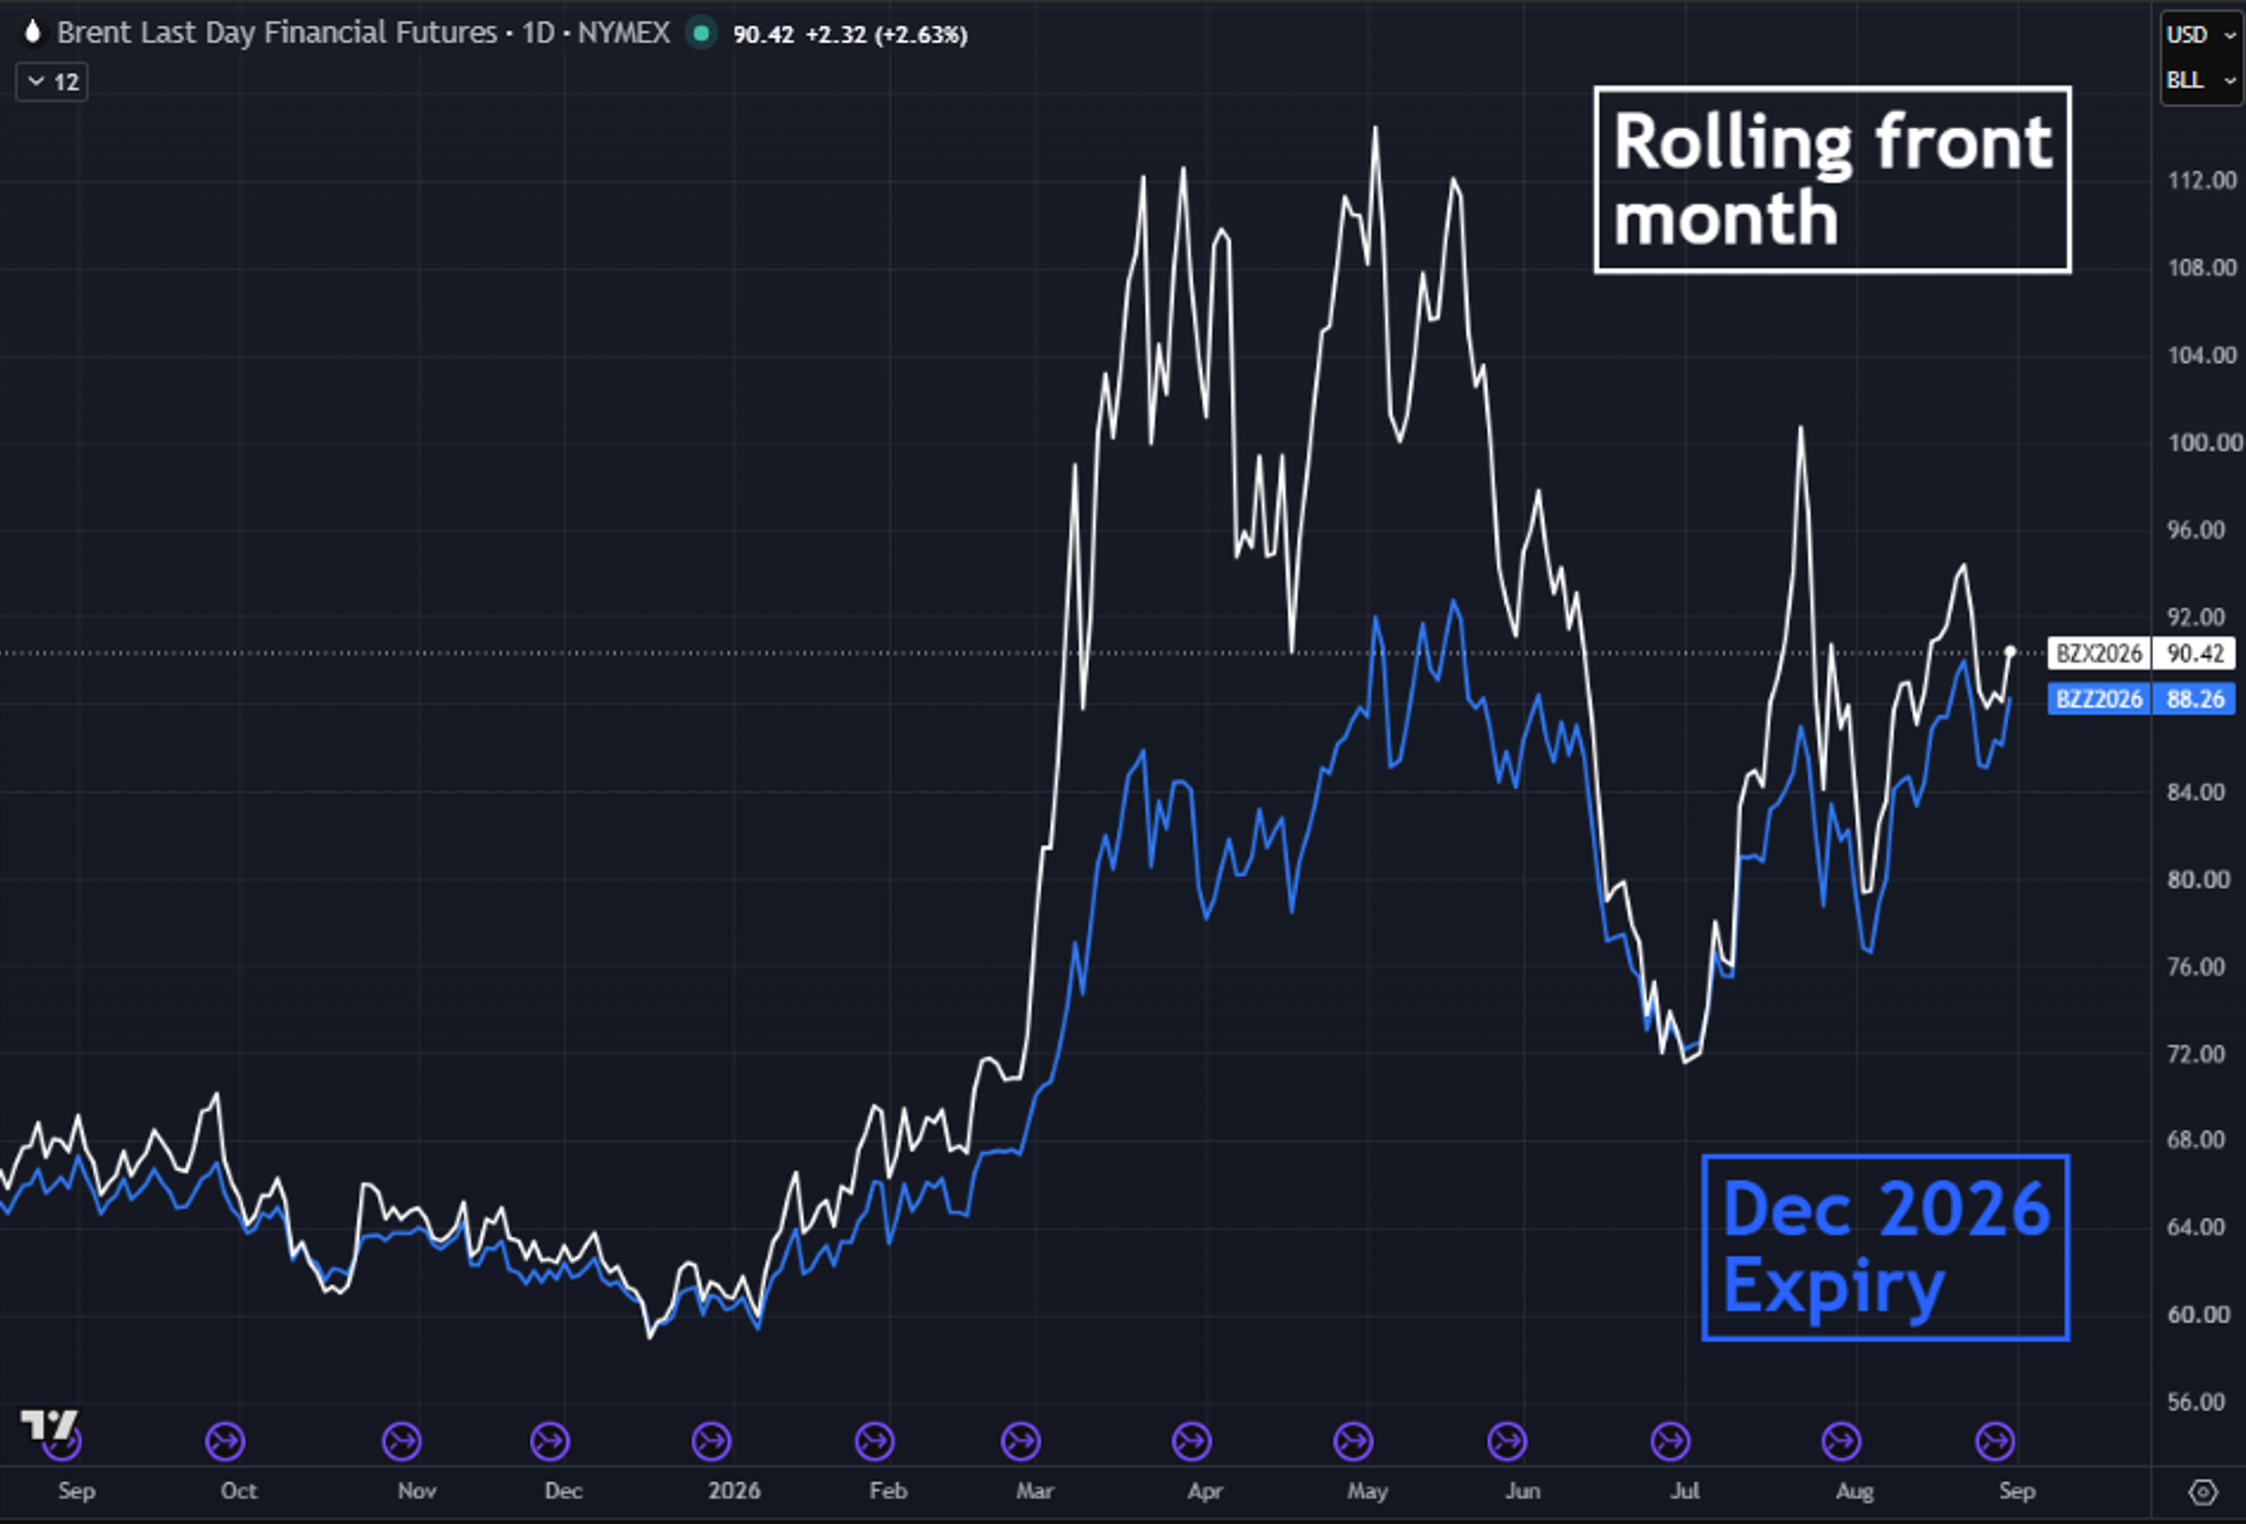
Below is a chart of Brent crude prices. That’s continuous rolling front month in white, and Dec 2026 expiry in blue-
Source: TradingView. As of 8/31/26.
You’ll note a healthy high $80’s price for December. And you’ll note that after the initial ~3-month spike, front month came in to pretty much meet December.
You may remember back in April/May, many oil pundits calling for $175+oil by now, which did not materialize. Why did that turn out to be the case?
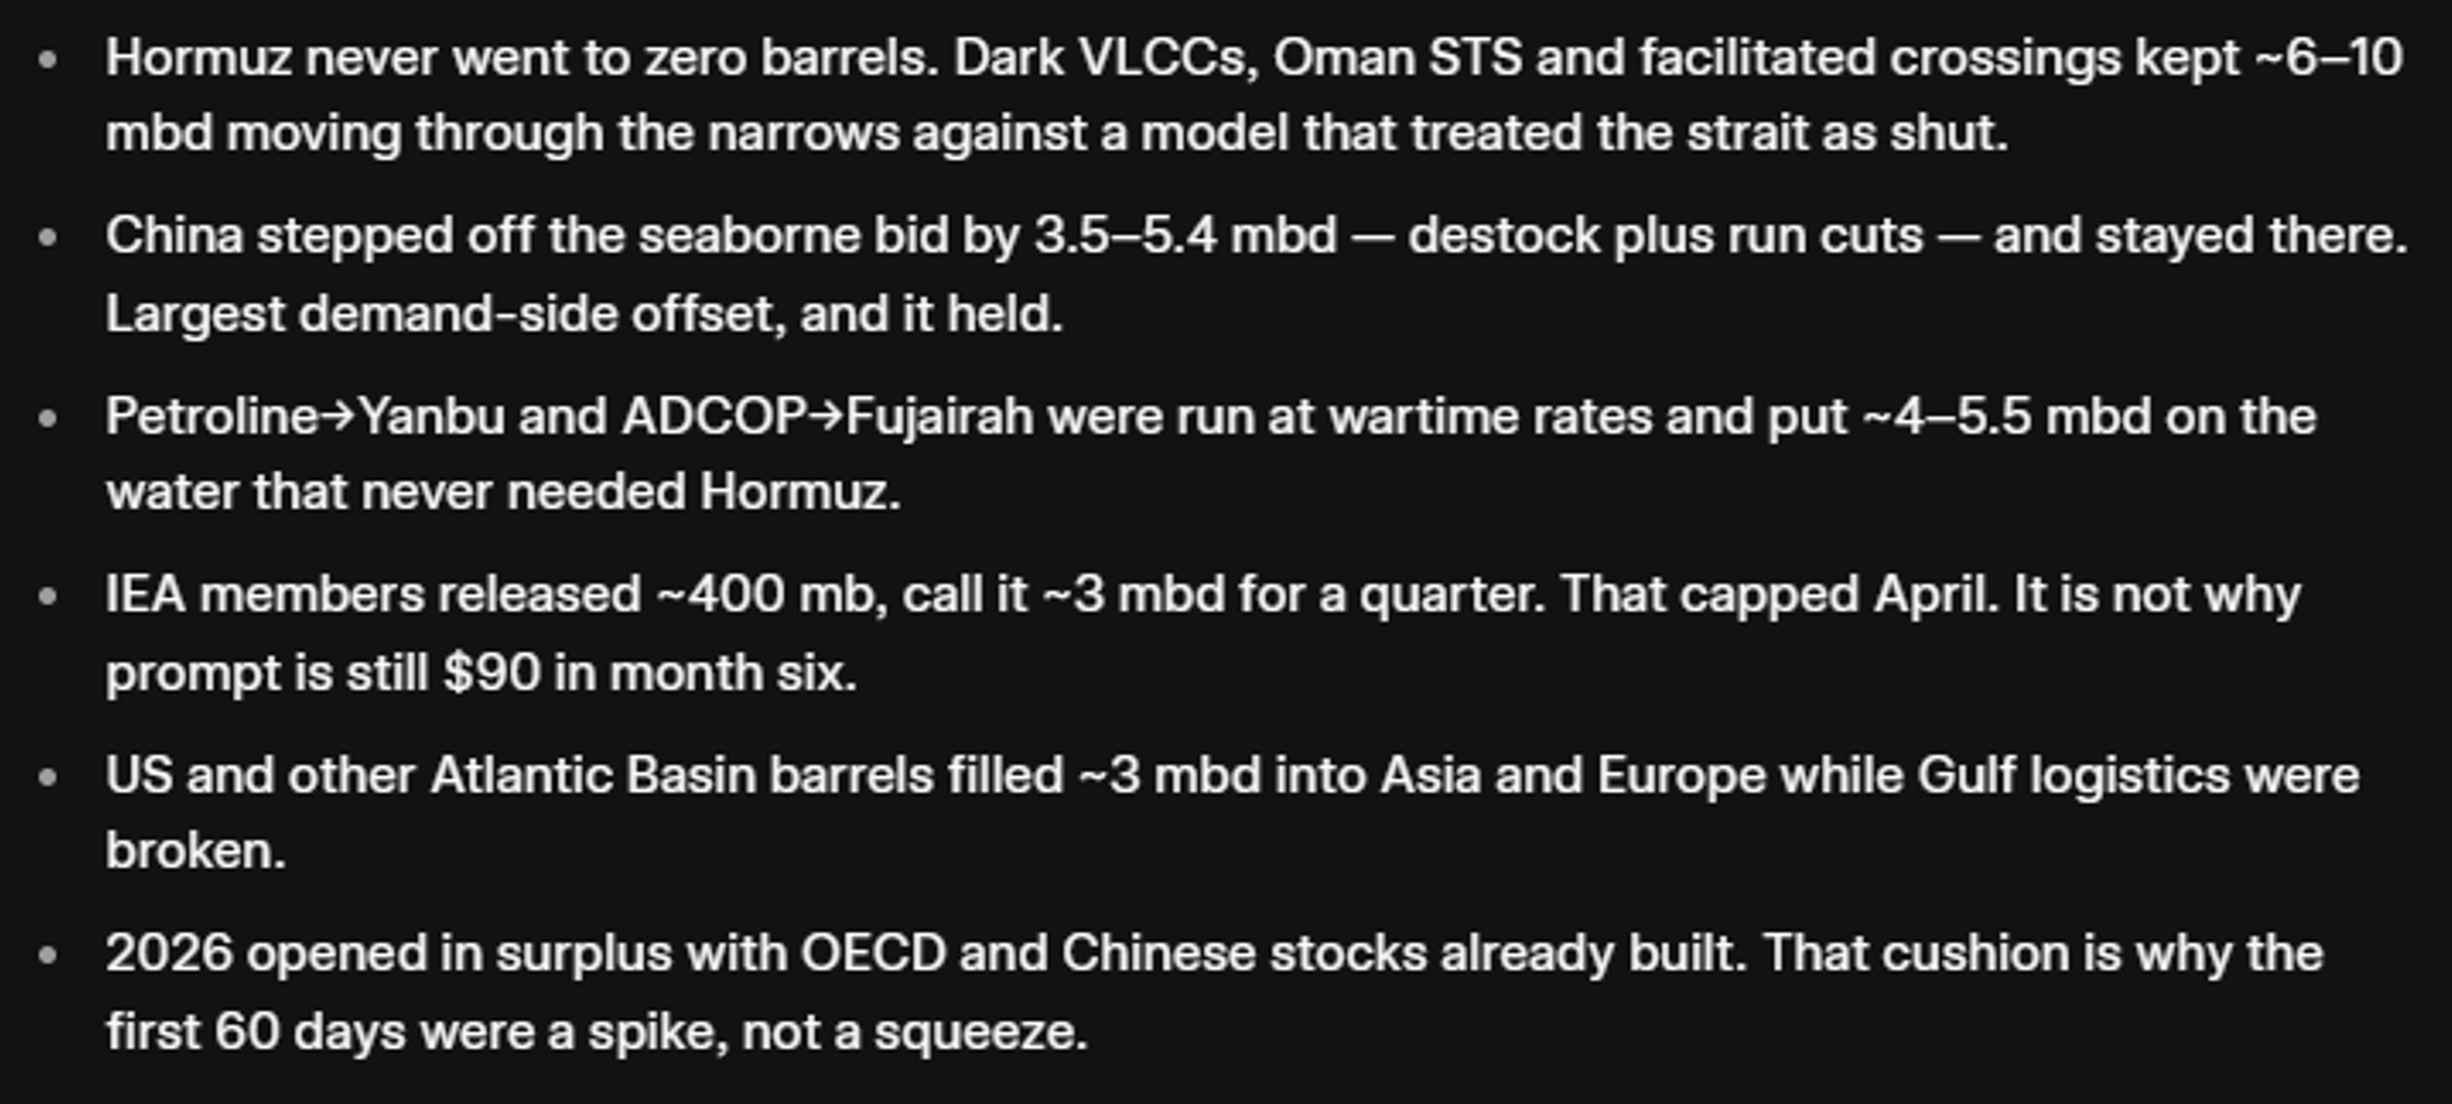
Source: Grok. As of 8/31/26.
Keeping oil prices subdued has been an important piece of the puzzle for Treasury Secretary Bessent, who had a VERY busy August. More on that below.
August Highlights
BTC ETFs See $3.5bn of Inflows, Largest Since July 2025
ETH ETFs See $1.8bn of Inflows, Largest Since August 2025
MSTR Sells $213mm BTC; Buys $370mm BTC; Issues $3.9bn of MSTR; Buys Back $610mm of STRC; Cash Balance Grows to $6.7bn
Senate delays Clarity Act Vote Until September 15th, Passage Unlikely
In Lieu of Clarity Act, SEC Issues Sweeping Rulemaking Proposal on Crypto
Trump Leads Press Conference with CFTC Chair, SEC Chair, crypto executives, et al with Bullish Crypto Comments, Crypto Prices Rocket Higher
Offline BTC Cold-Storage Custody Device “Coldcard” Is Hacked Via Firmware Update, >$100mm BTC Stolen
Tether Passes First Audit Ever From KPMG US
Trump-backed World Liberty Financial Receives Banking Charter
Wintermute Registers As US Broker/Dealer
JPMorgan Ends Banking Relationship with Polymarket Over Regulatory Concerns
BitGo Acquires NYDIG’s Institutional Crypto Trading Business
Bybit Sues North Korea’s Lazarus Group for $1.5bn Over 2025 Hack
| Asset Class | August | July | Q2-26 | Q1-26 | YTD | Q4-25 | Q3-25 | Q2-25 | Q1-25 | 2025 | 2024 | Instrument |
|---|---|---|---|---|---|---|---|---|---|---|---|---|
| Bitcoin | 25% | 7% | -14% | -22% | -10% | -23% | 6% | 30% | -12% | -6% | 121% | BTC |
| NASDAQ | 4% | -7% | 28% | -6% | 17% | -6% | 2% | 18% | -8% | 20% | 25% | QQQ |
| S&P 500 | 3% | 0% | 15% | -5% | 12% | 2% | 8% | 11% | -5% | 16% | 23% | SPX |
| Total World Equities | 3% | -1% | 13% | -2% | 14% | 2% | 8% | 10% | -1% | 20% | 14% | VT |
| Emerging Market Equity | 5% | -6% | 20% | 4% | 23% | 2% | 11% | 10% | -5% | 31% | 4% | EEM |
| Gold | 10% | 1% | -14% | 9% | 3% | 11% | 16% | 6% | 19% | 64% | 27% | GLD |
| Long-Duration US Treasuries | 0% | -5% | 0% | -1% | -5% | -1% | 3% | -5% | 2% | -1% | -8% | TLT |
| High-Yield Corporate Credit | 0% | -1% | 1% | -1% | -1% | 1% | 4% | 3% | -2% | 6% | 8% | HYG |
| Copper | 1% | 5% | 10% | -2% | 14% | -6% | 11% | 15% | 2% | 23% | 19% | CPER |
| USD | 0% | -1% | 0% | -2% | 1% | -1% | -1% | -7% | -4% | -9% | 7% | DXY |
| Volatility Index | -7% | -3% | -55% | -22% | 0% | -8% | -4% | -24% | 28% | -14% | 3% | VIX |
| Oil | 4% | 21% | -16% | 84% | 93% | -6% | 1% | -5% | 2% | -8% | 13% | USO |
SOURCE: GROK. AS OF 8/31/26
Was That The Bottom?
BTC and crypto were up a lot in August. Why is that?
The answer IMO is a bit tricky, so I’ll lay it out as clearly as I can.
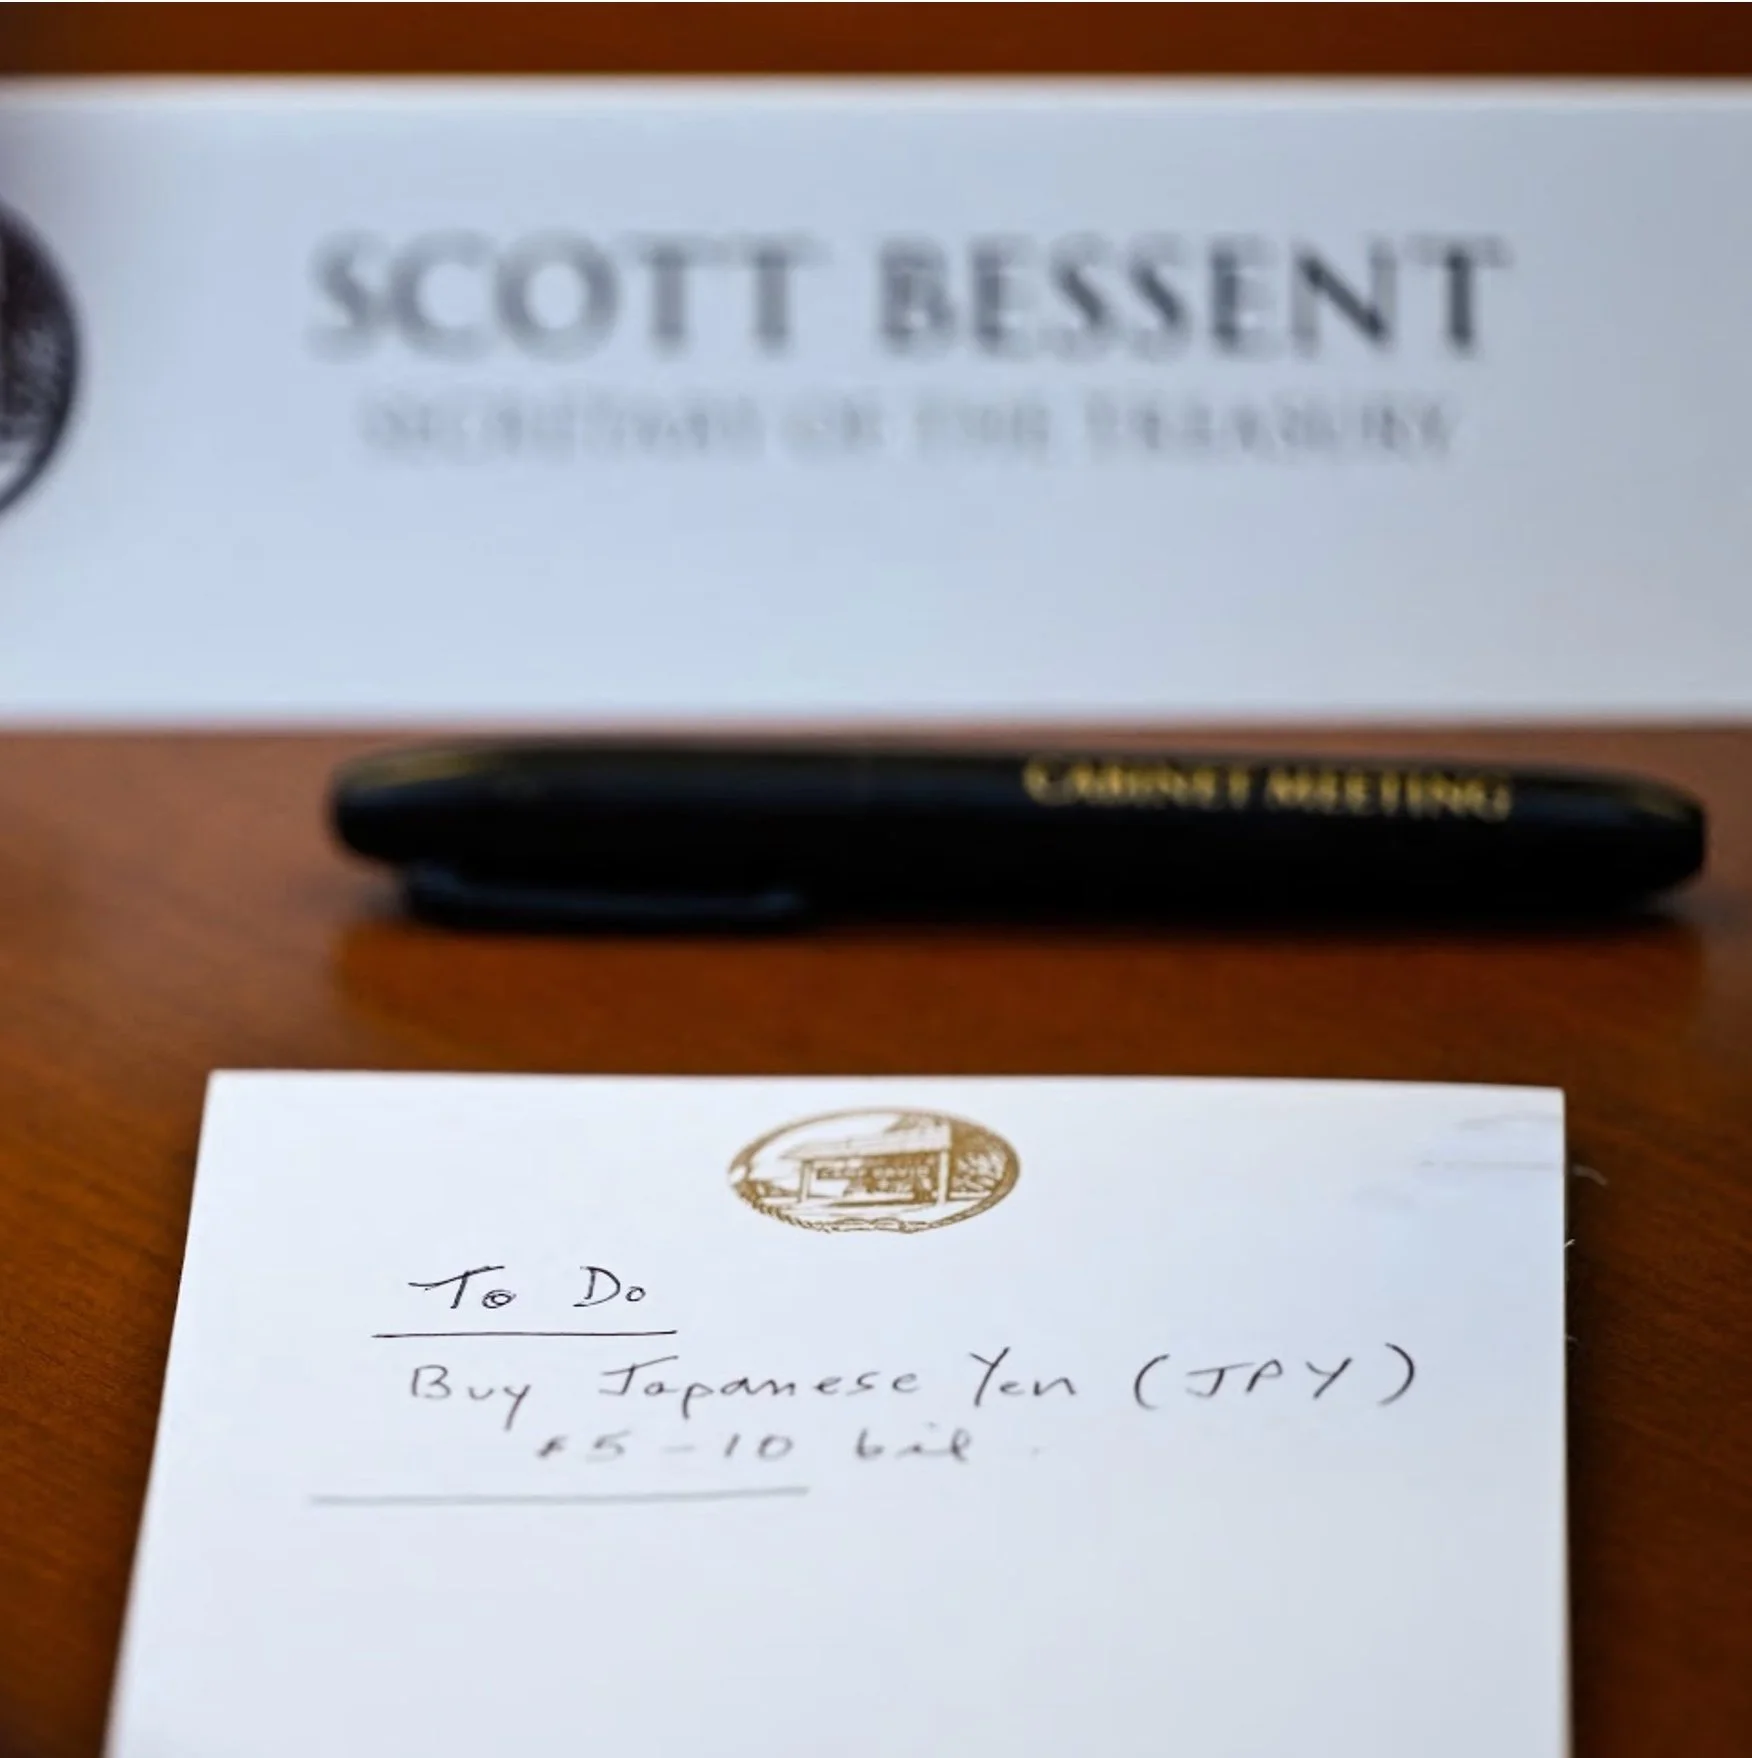
Coming into August, you had a macro backdrop of crashing Yen and spiking JGB yields. Reuters captured this incredible piece of “marketing” for Bessent, who intervened in USDJPY alongside BoJ for the first time since 1998-
Source: Reuters. As of 8/1/26.
Some of this Japan stress started showing up in the back end of US Treasuries. US 30Y tagged a 19-year high.
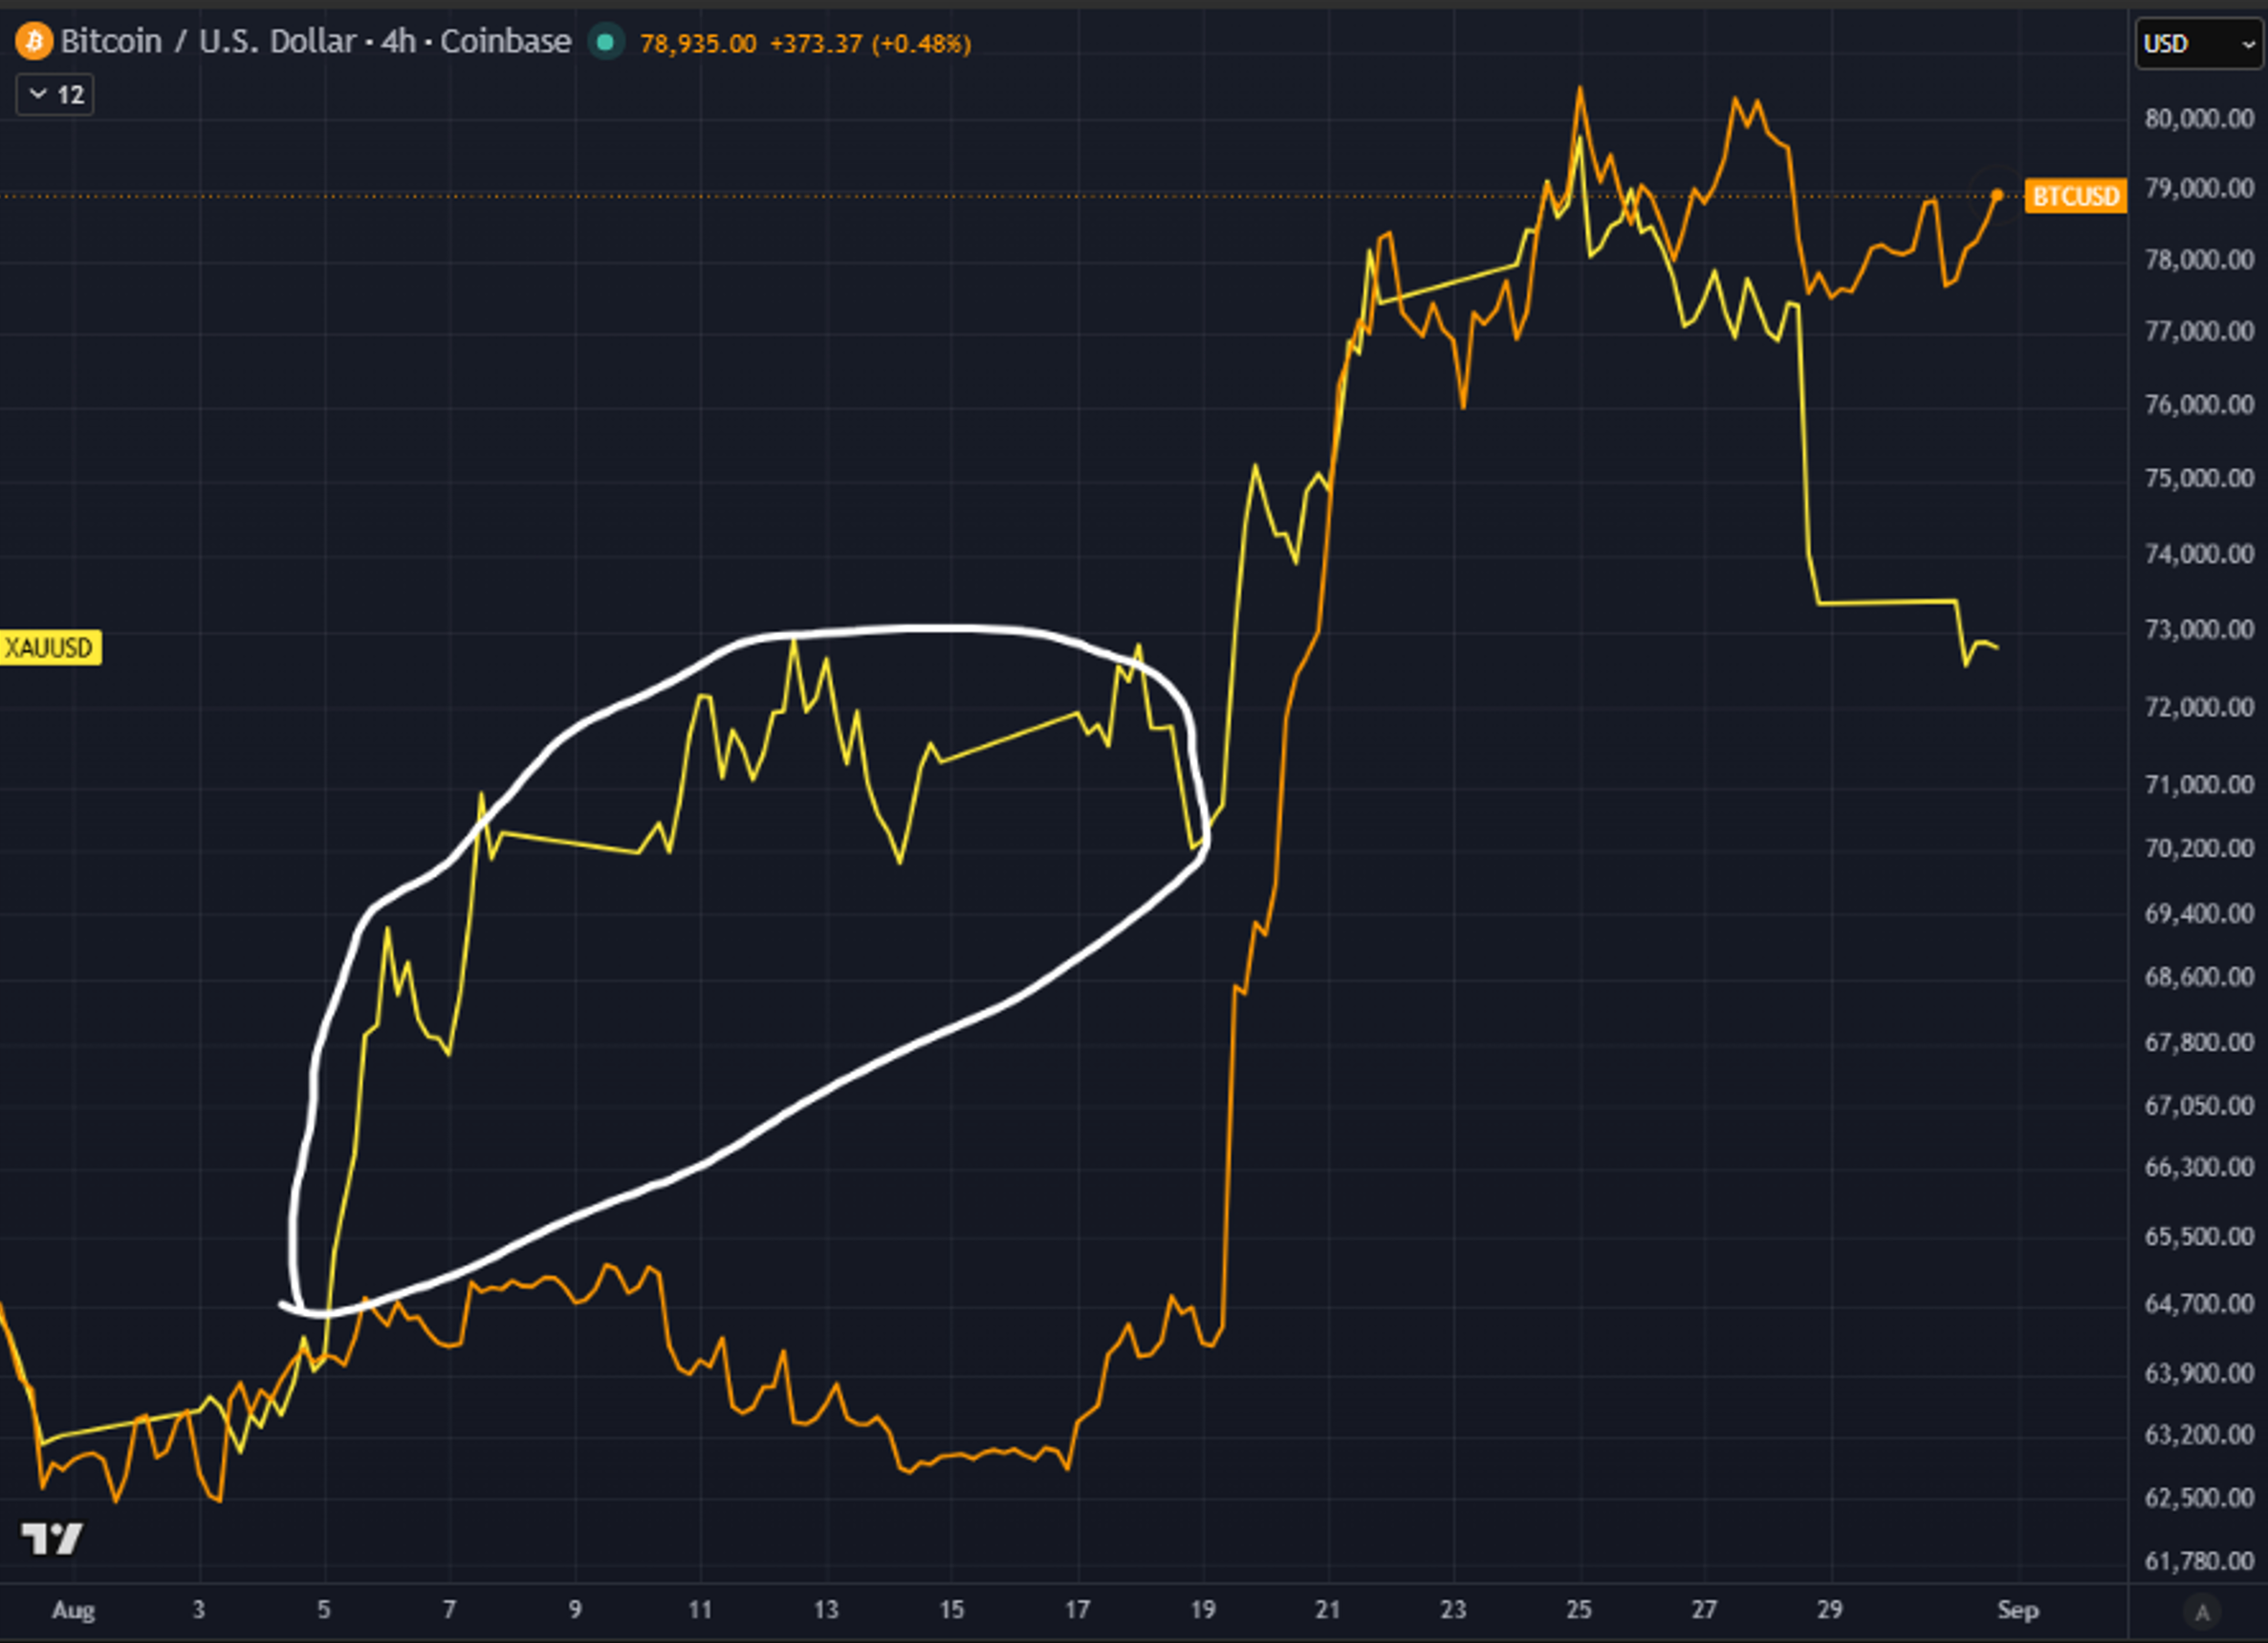
Gold traded up ~10% in the first part of August in response to this macro stress. Notably, BTC/crypto did not participate with gold in this rally in early August (white circle)-
Source: TradingView. As of 8/31/26.
On August 13th, right as Clarity Act’s hopes of passing before the recess were finally fully dead, the White House announced a press conference with crypto and technology leaders would be held on August 19th. Worth noting that BTC/crypto prices were flat on the announcement of the presser.
That brings us to August 19th - the lynchpin day of this August pump. It was a dual catalyst day for BTC and crypto. In the morning, you had Bessent announcing the doubling of long-end purchases by the Treasury from up to $2bn per operation to up to $4bn per operation. The market takes this as confirmation of the debasement trade. Gold rips. A few hours later, BTC starts ripping too.
Then, that afternoon at ~2:30 ET, Trump hosts a press conference. He’s got the CFTC chair and the SEC chair up with him. He’s got Brian Armstrong and the Winklevoss twins and Vlad from RobinHood and Brad from Ripple and a handful of other crypto folks.
You can watch the whole thing here. It’s 35 mins long.
This was by far the most consequential headline-
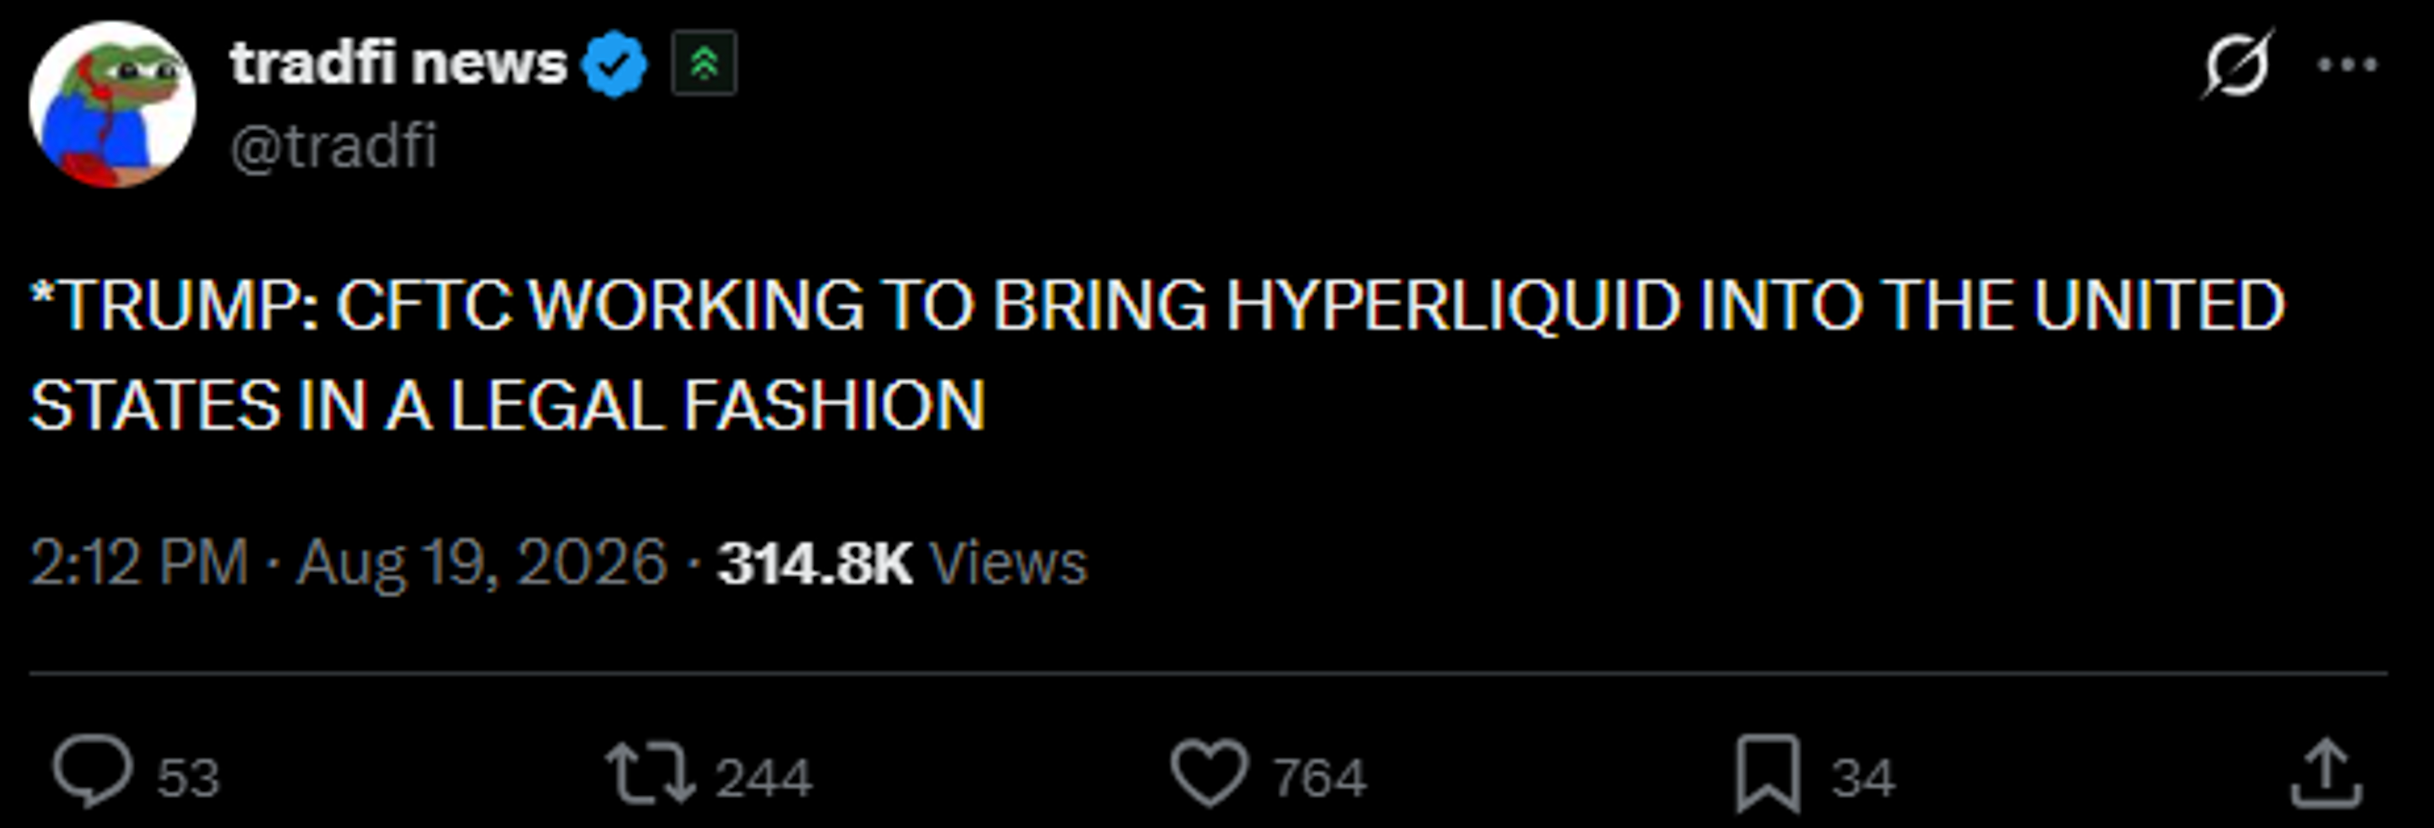
Everything else on BTC/crypto from Trump and others was pretty meaningless.
When asked about the admin potentially buying BTC or crypto, Trump said, “Well, it’s been talked about… certainly it’s been talked about. It’s taken a lot of pressure off the dollar… if you came in with recommendations, I would certainly listen.” ….whatever that means.
CFTC Chair Selig mentioned that CFTC was ready to act with rulemaking on crypto (similar to SEC’s announced rulemaking) if Clarity Act ends up failing to pass. But this was already known and expected.
The 8/19 presser ripped HYPE >20% and the rest of crypto ripped too, with gold following. The next day on the 20th, Bessent went on CNBC and said Treasury could do more than $4bn if needed, adding further fuel to the fire of the Debasement Trade – BTC/crypto/gold all ripped further still before topping out on 8/25.
That’s how I see it. BTC/crypto did NOT participate in the “Debasement Trade” at the beginning of the month, but the dual catalyst of Bessent + Trump presser on the 19th was a strong enough combo to send BTC/crypto MUCH higher.
The backdrop for this setup matters. First off, it was peak summer – very thin trading volumes.
Below is BTC price and BTC $ volume on Coinbase-
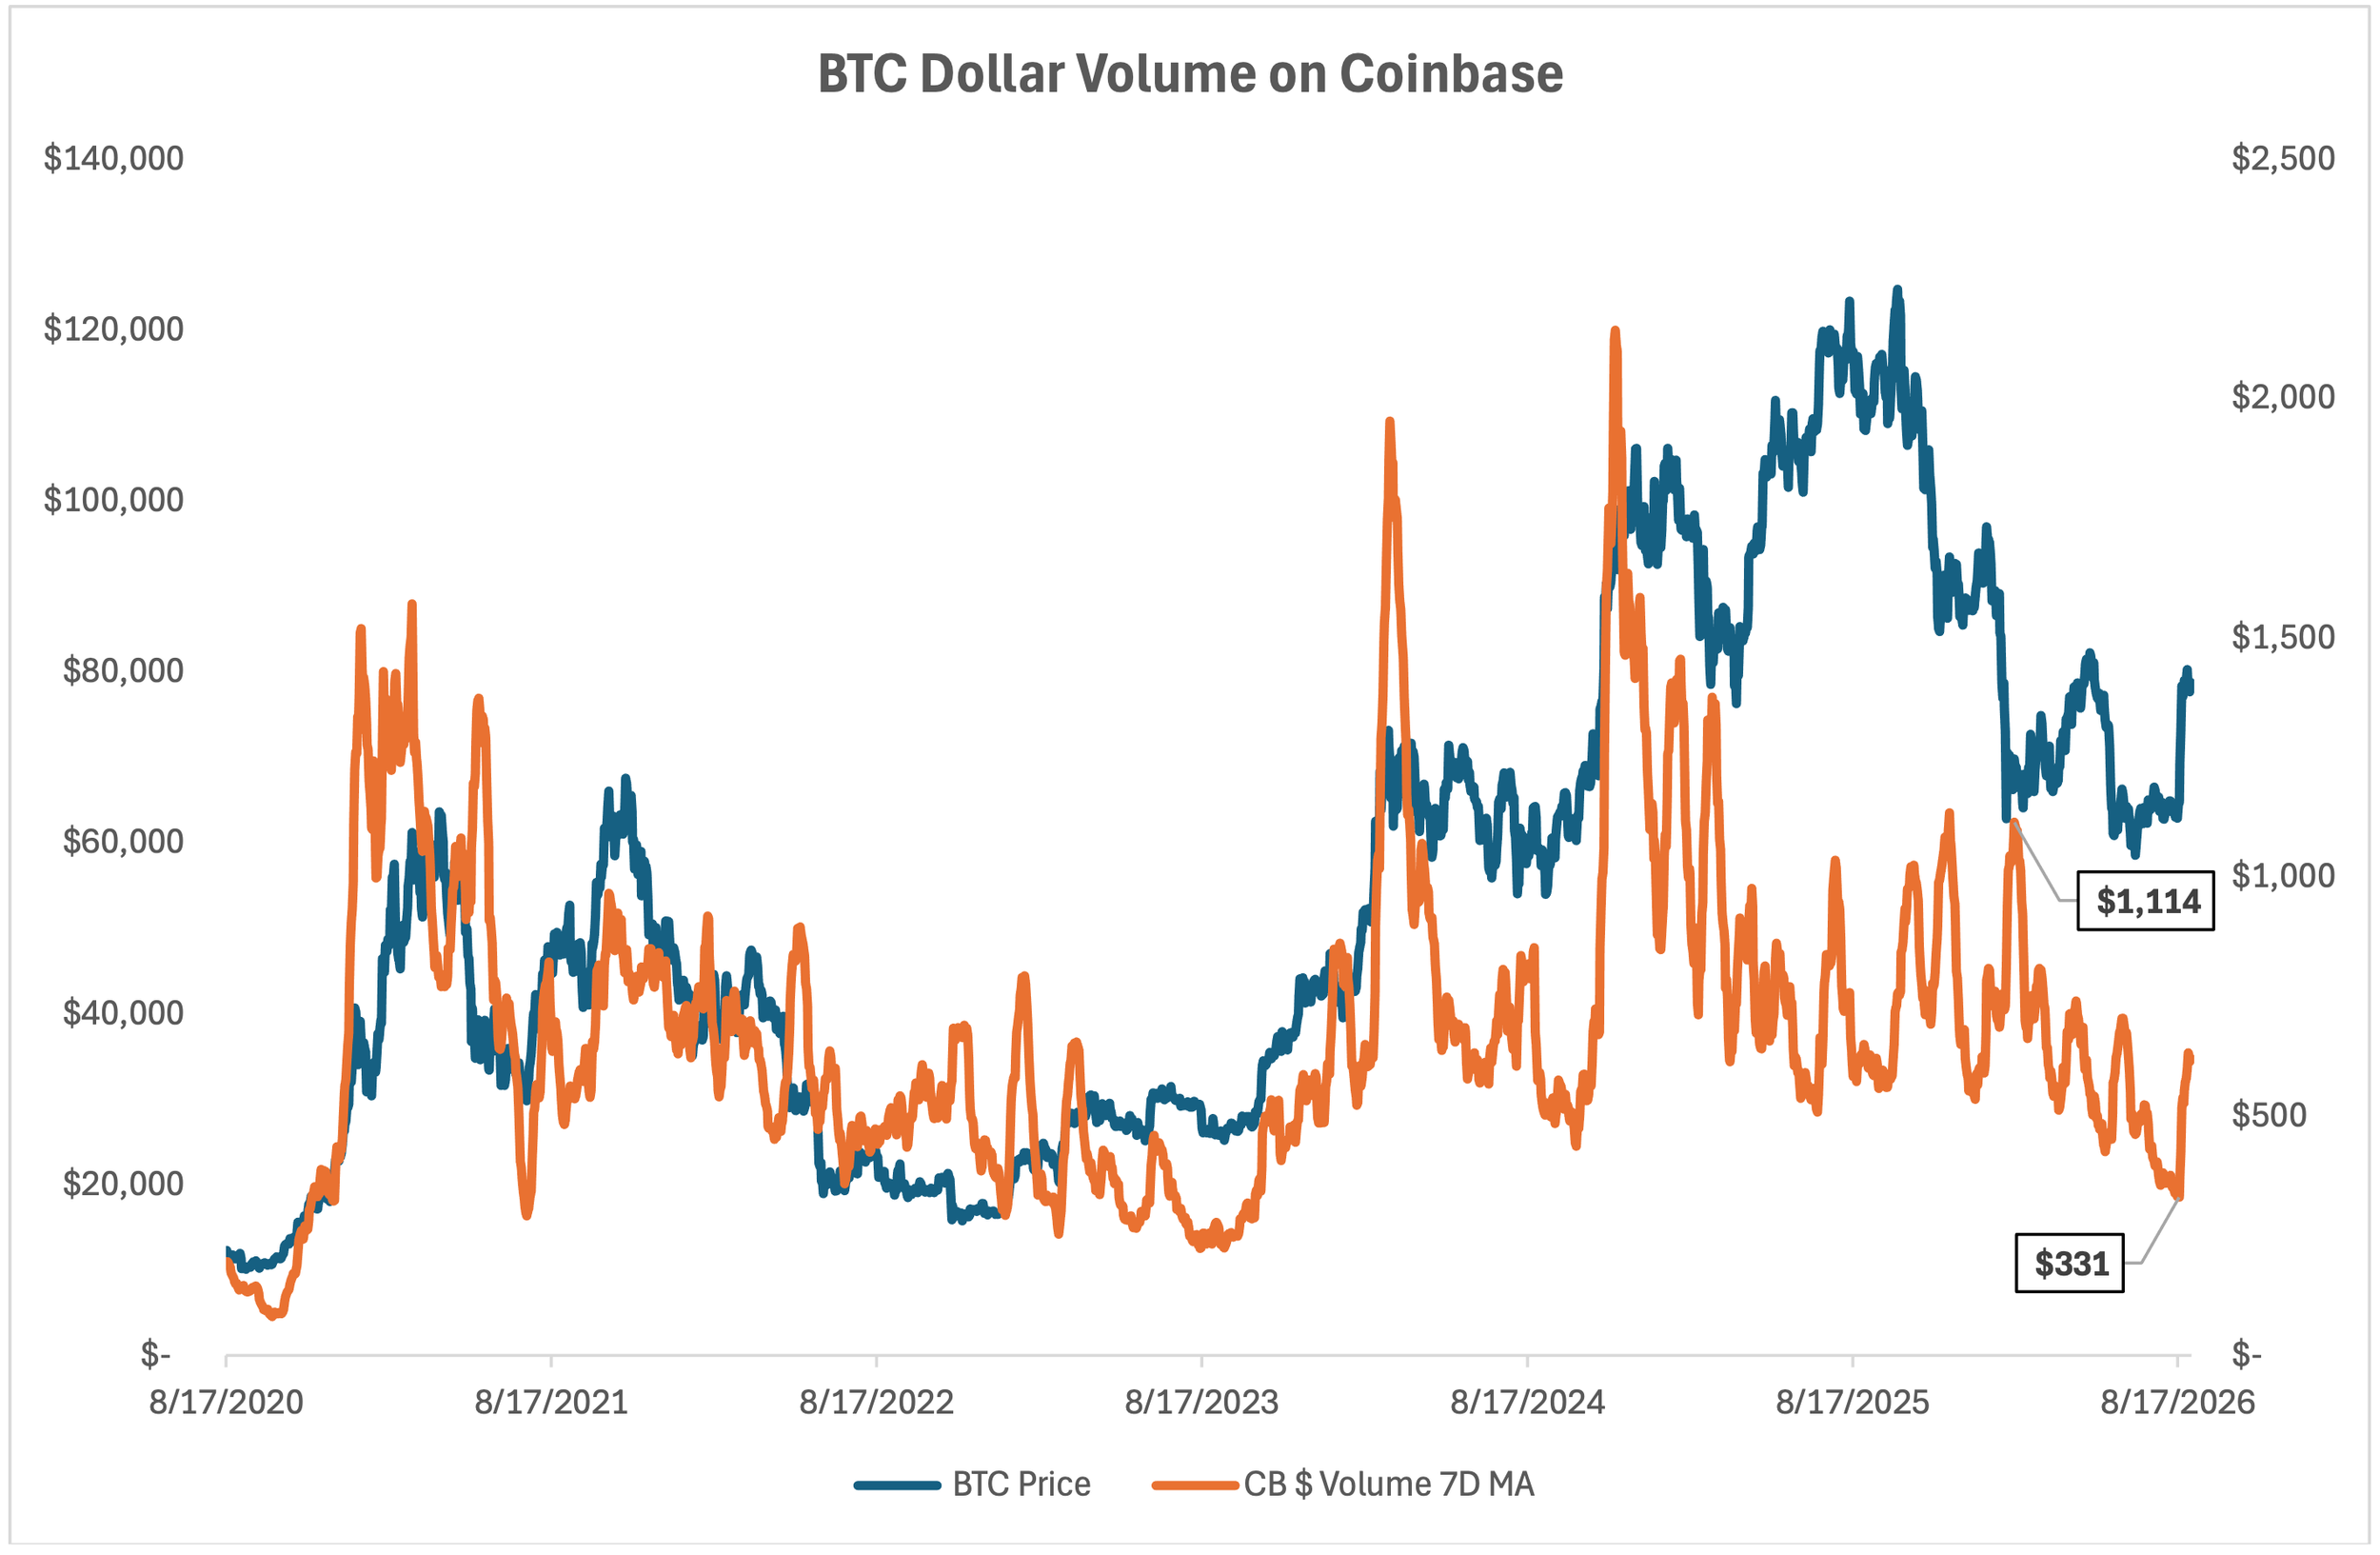
Source: TradingView. As of 8/31/26.
Note the total collapse in $ volume. Down 70% from the $ volume in the Feb 2026 crash. The absolute opportune time for a short squeeze.
Below in the top panel you’ll note a collapsed realized vol (blue) and implied vol (orange). As cheap of vol as there’s ever been for BTC. The absolute opportune time for a squeeze.
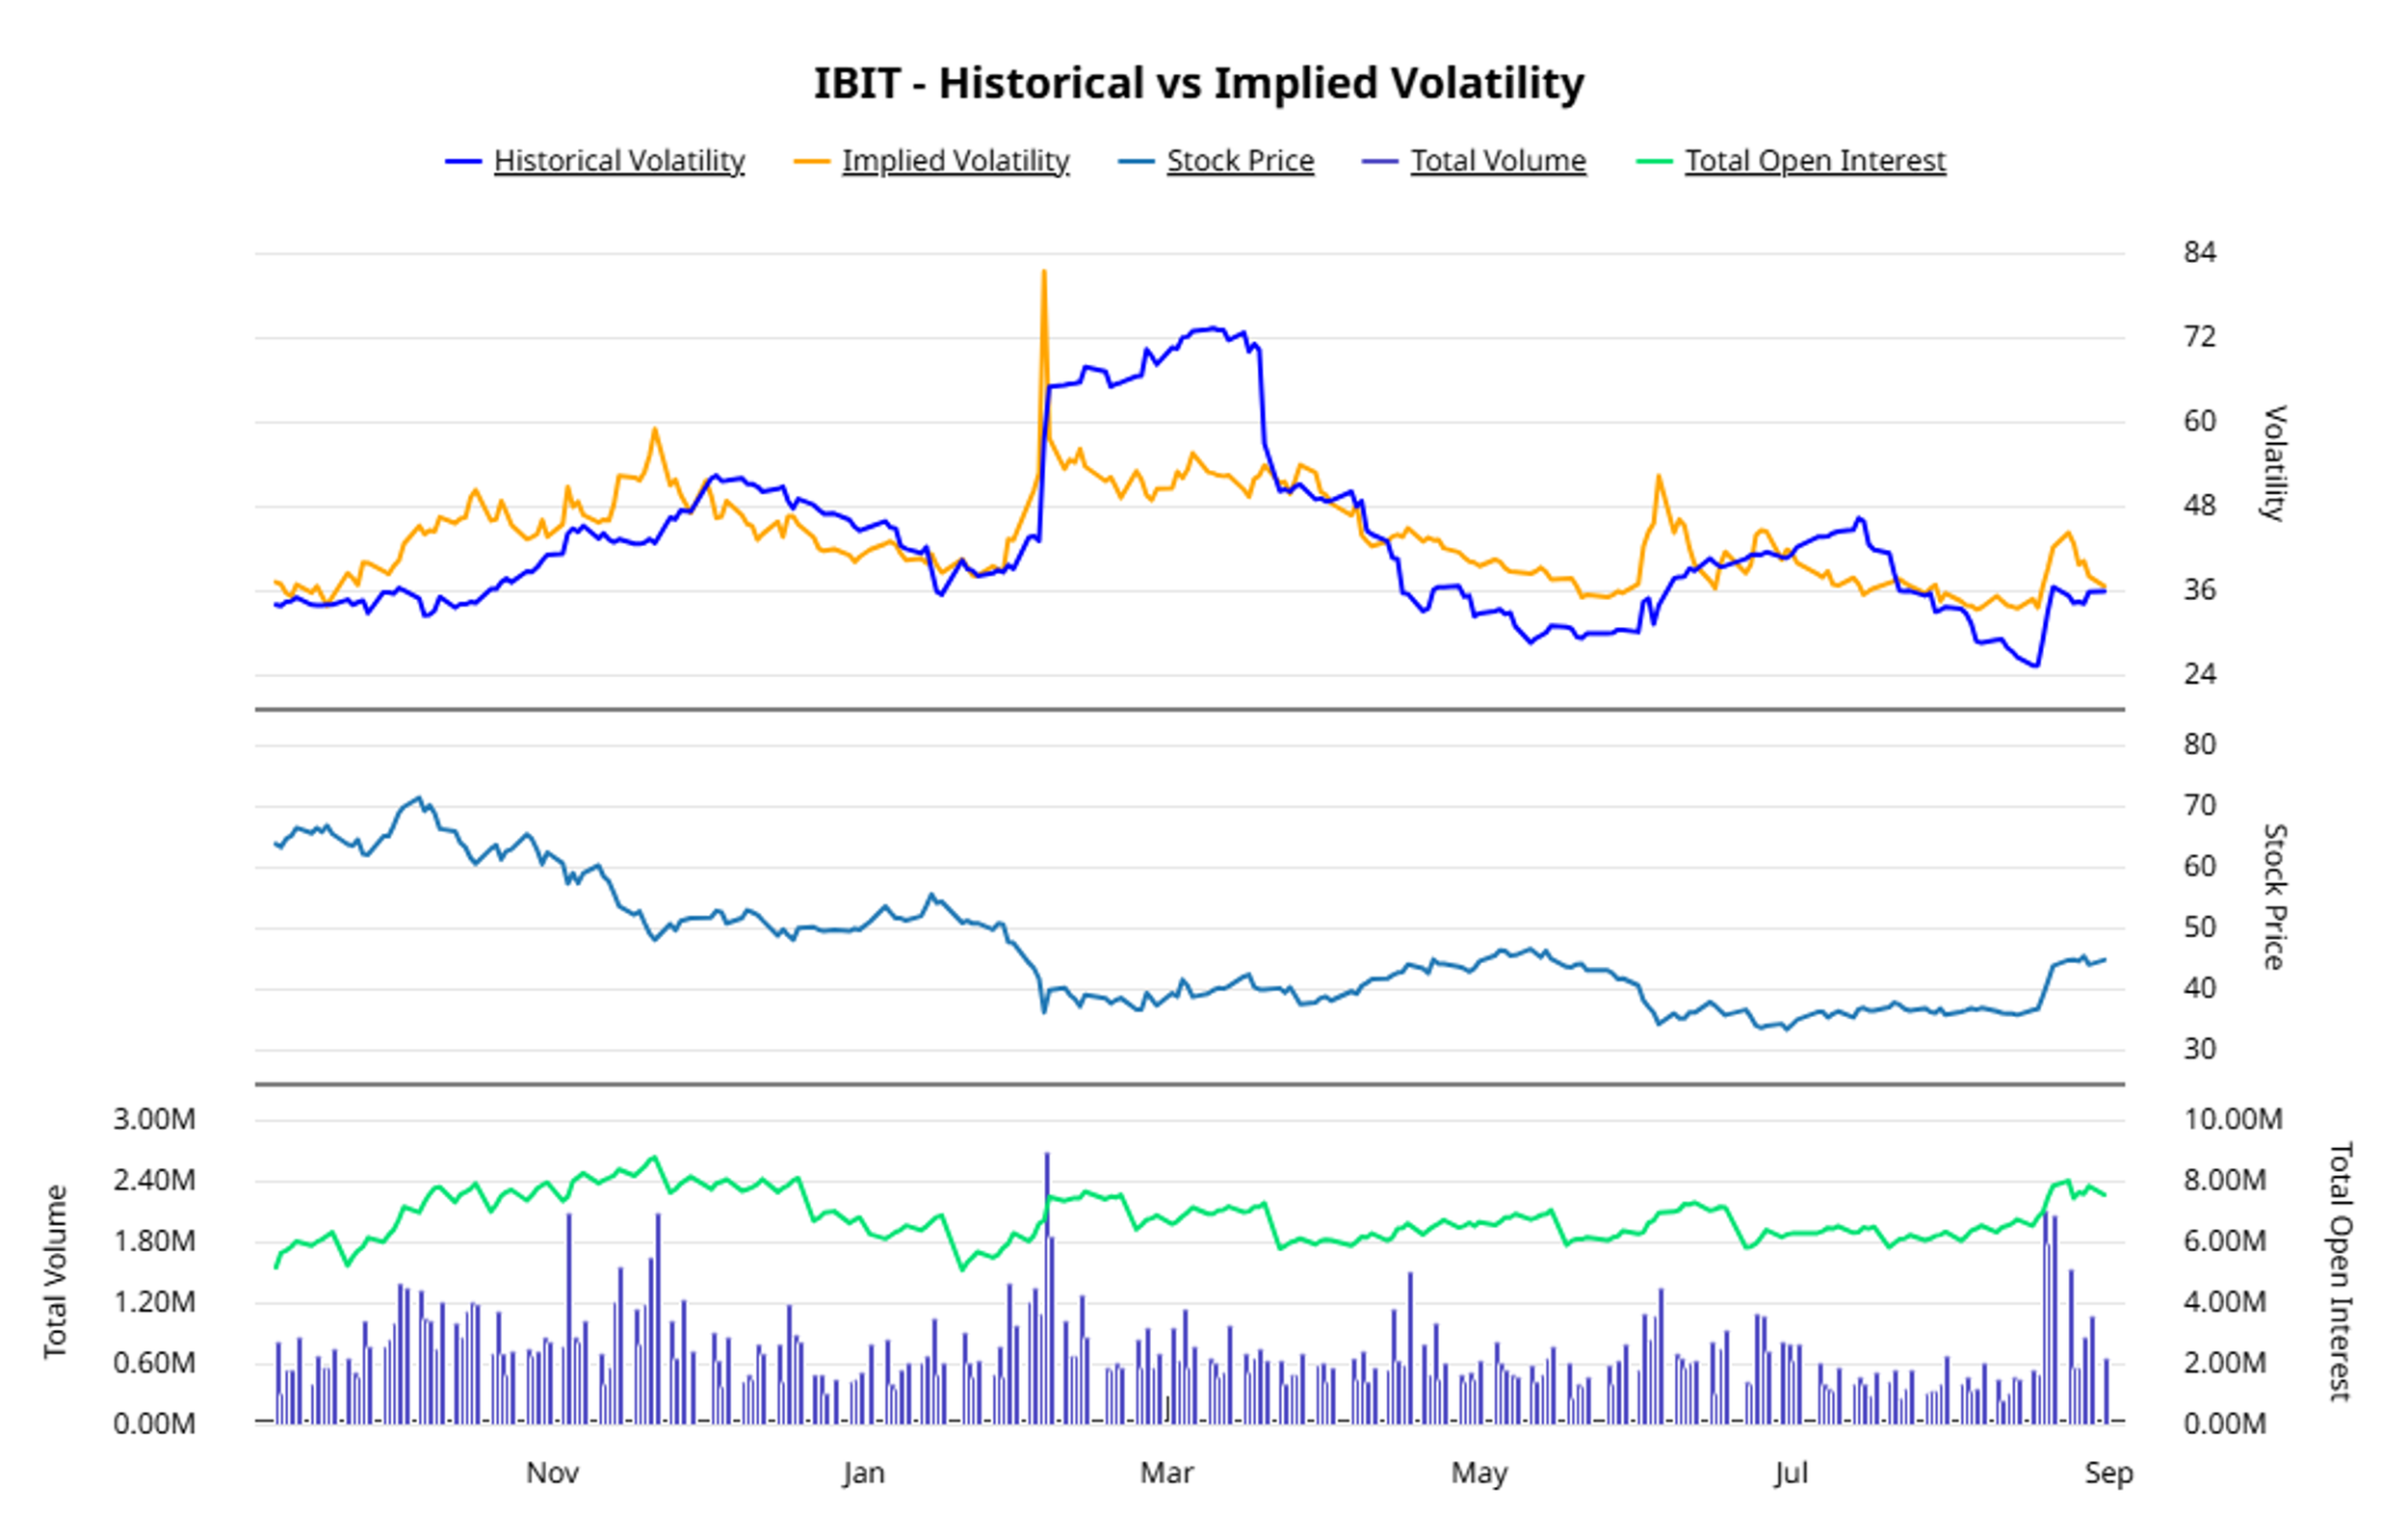
Source: barcharts.com. As of 8/31/26.
So that’s the backdrop for this big move. Historically low volume and historically low realized and implied volatility.
I noticed one other thing too. Below is a chart that shows: 1) price; 2) aggregate BTC open interest on crypto exchanges; and 3) aggregate perp funding rates-
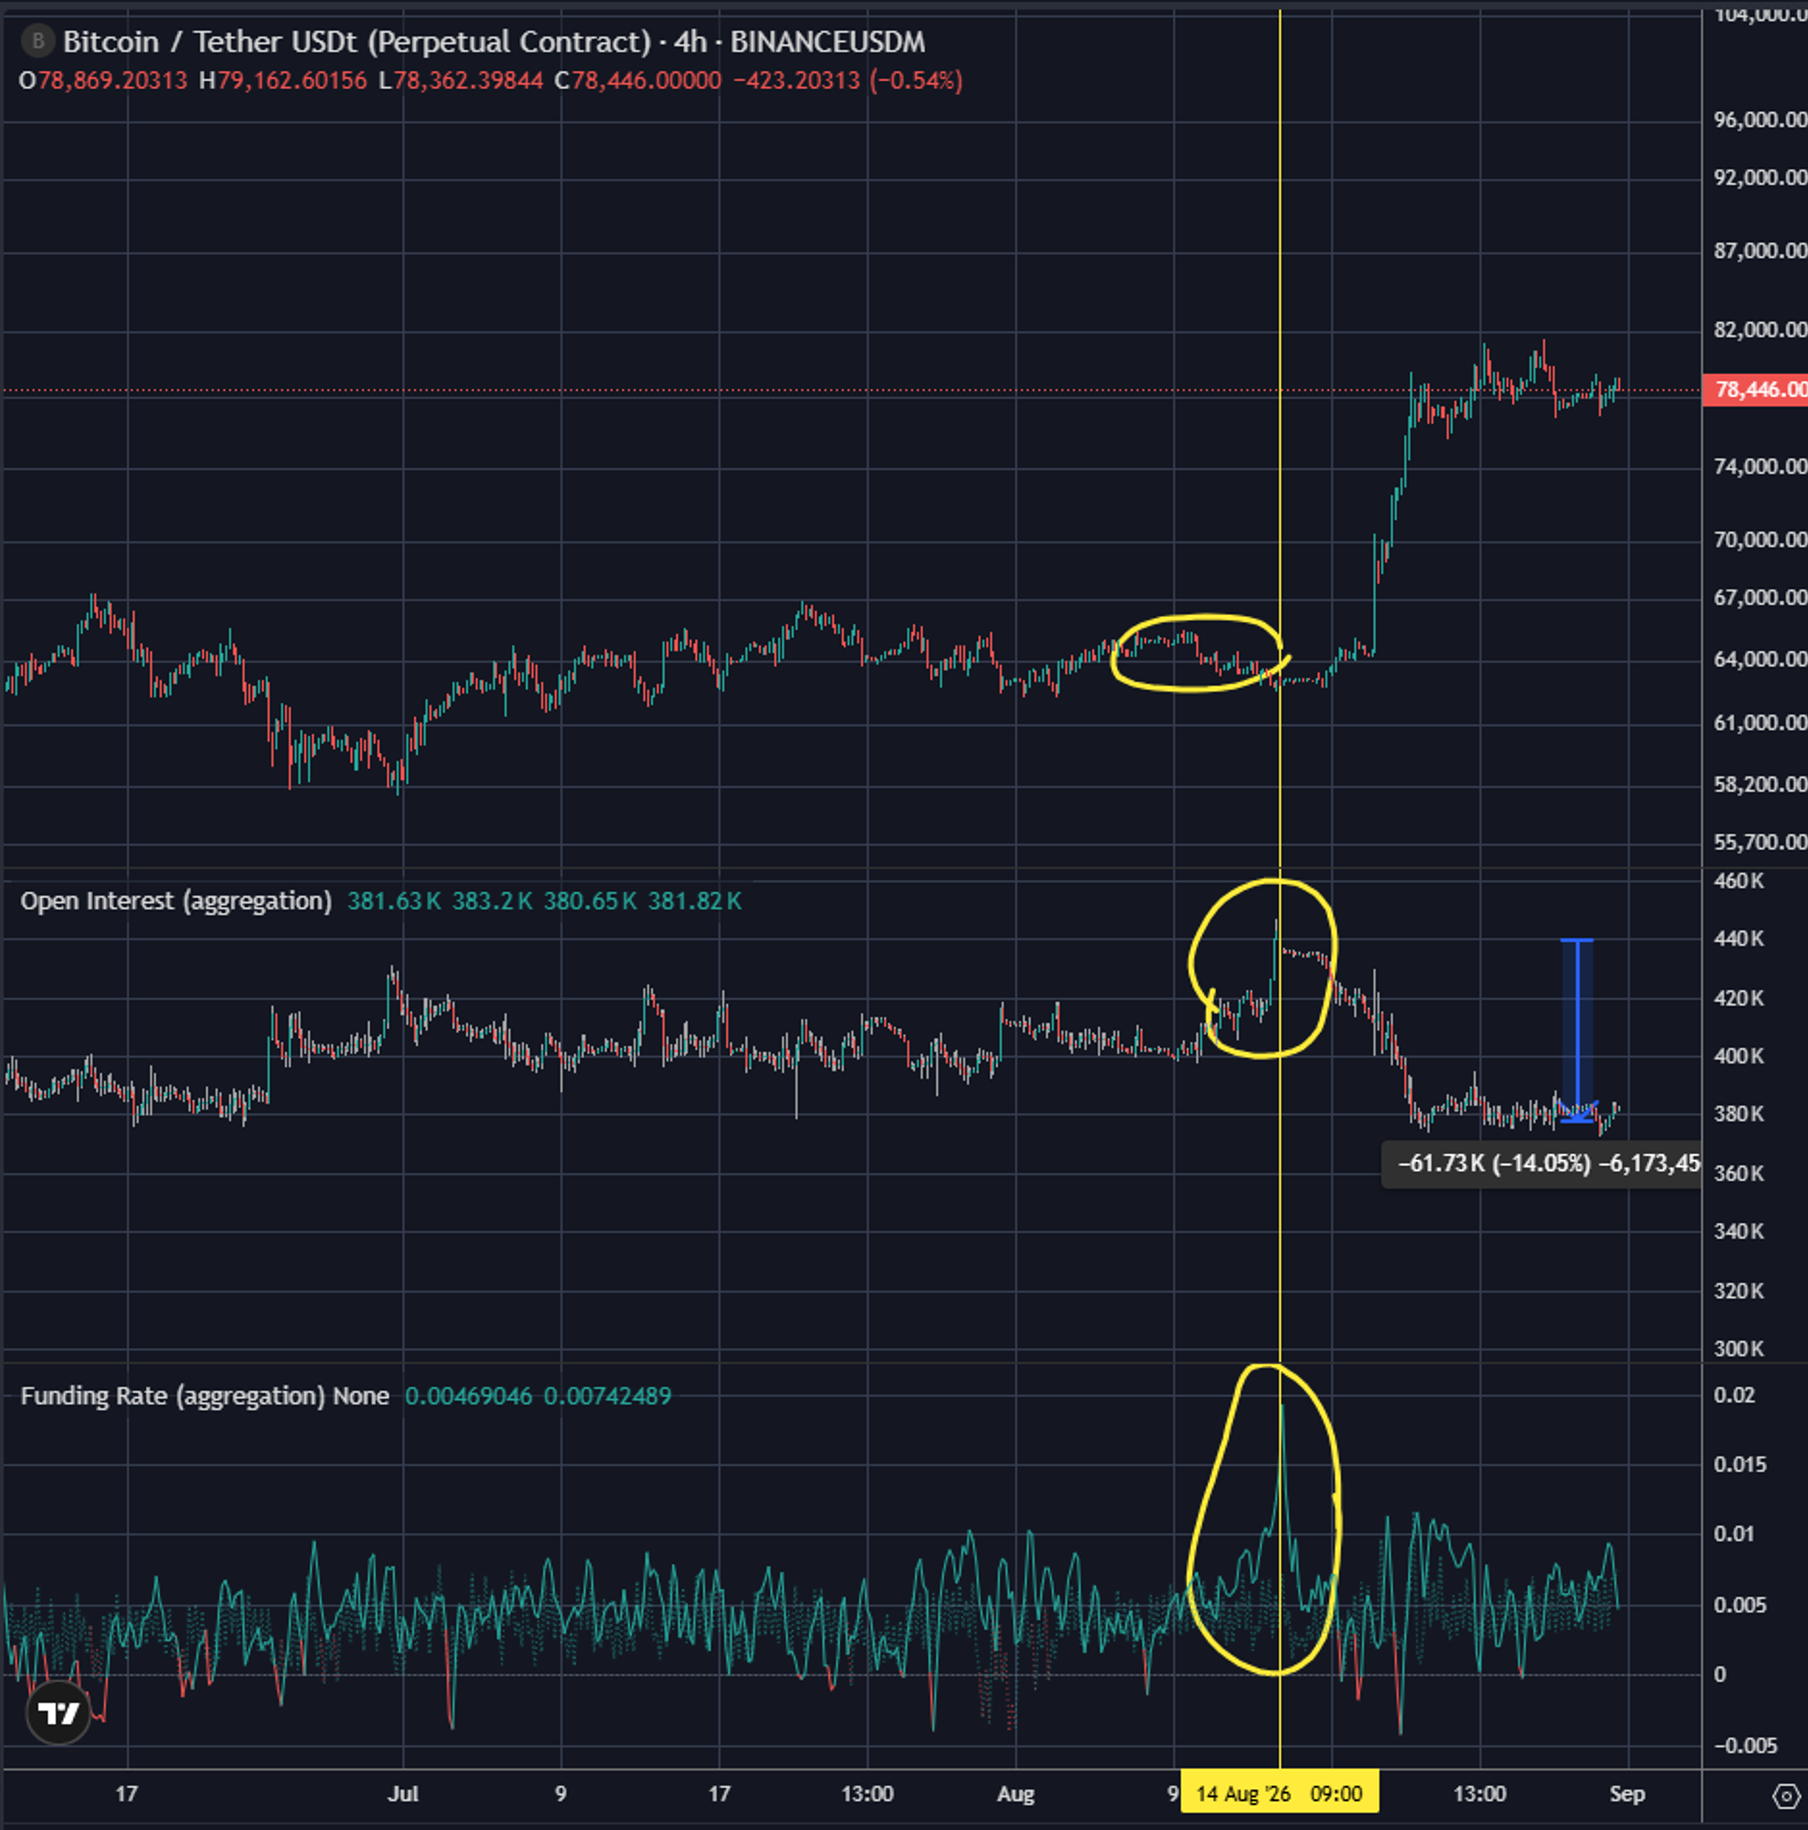
Source: TRDR. As of 8/31/26.
Note that big spike in OI and funding rates that peaked at the vertical yellow line on 8/14. This ramp happened immediately after the Trump crypto/technology presser was scheduled. It happened with flat BTC price action, and it happened after the initial gold pump. This aggressive build in OI and funding rates was the positioning that massively profited off the squeeze higher. You will also note the 14% extinguishment of OI (blue arrow). Textbook signature of a short squeeze.
All of the above is the backdrop for the question, was that the bottom? I tried to answer - “what was that?” to then try and answer - “was that the bottom?”
I’m mostly calling what just happened a short squeeze. It was positioning-driven and took advantage of a unique 1-2 catalyst combo (Debasement Trade + Trump presser) to go squeeze a low volume, low vol market at the peak of summer.
So can we squeeze further? Can the same sort of mechanism that got us +25% in August get us another +20% from here? My base case is no. I don’t think we have the fuel to squeeze a lot higher from here. I could be wrong, but that’s what it looks like to me.
OK, so that means if we want to head higher from here, we’re going to need some combination of new buyers and reduced sellers – and that needs to net out to a lot of buying for price to go a lot higher from here. So the question is- did the price move we just had induce a lot more new buying?
Below is IBIT. Note the volume on this move. Certainly sizeable. Probably the second largest volume event since the price top-
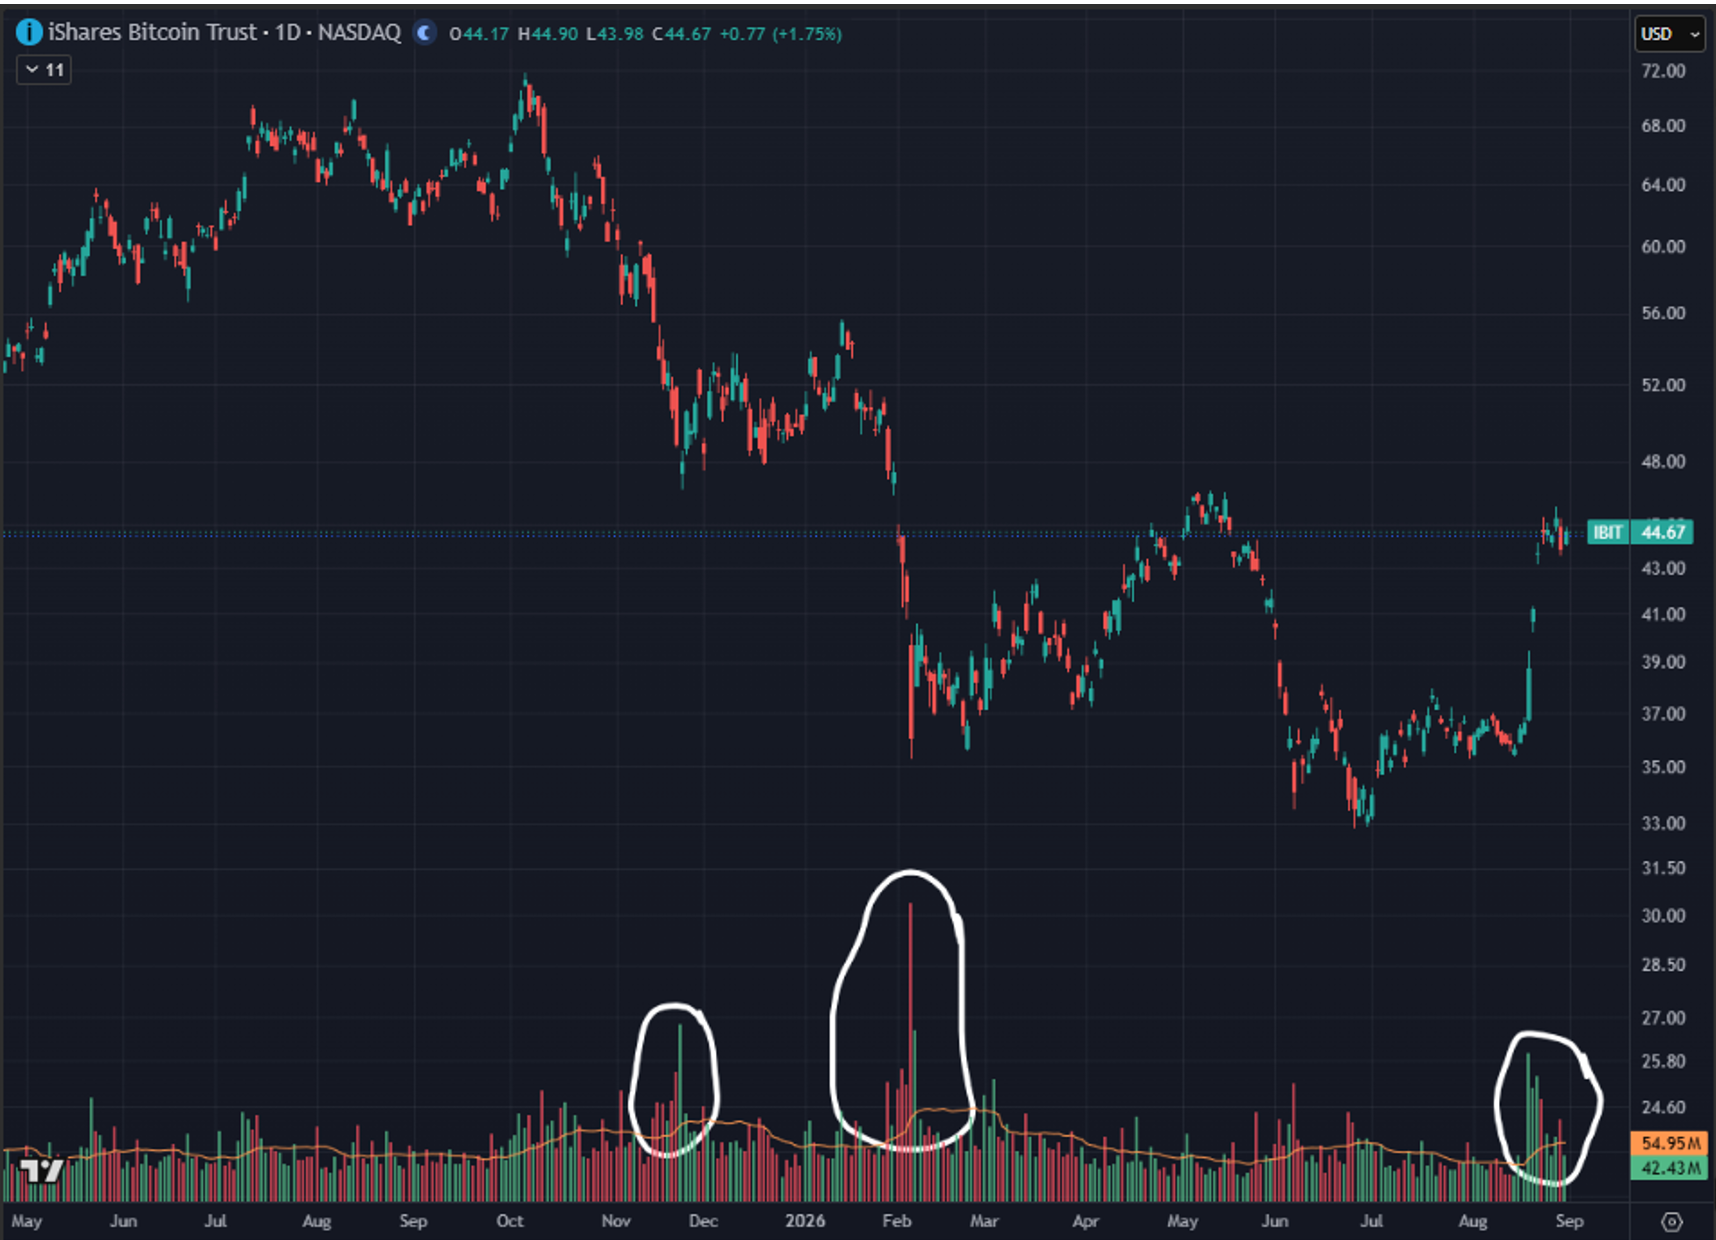
Source: TradingView. As of 8/31/26.
Volumes have dropped off a lot from the first few days of the pump. We may be seeing the beginnings of a lack of follow-through. If we were able to punch through those previous highs on good volume and then hold that breakout, I think you’d have to think hard about calling it a major bottom.
ETHA chart below. A bit of a different profile than IBIT-
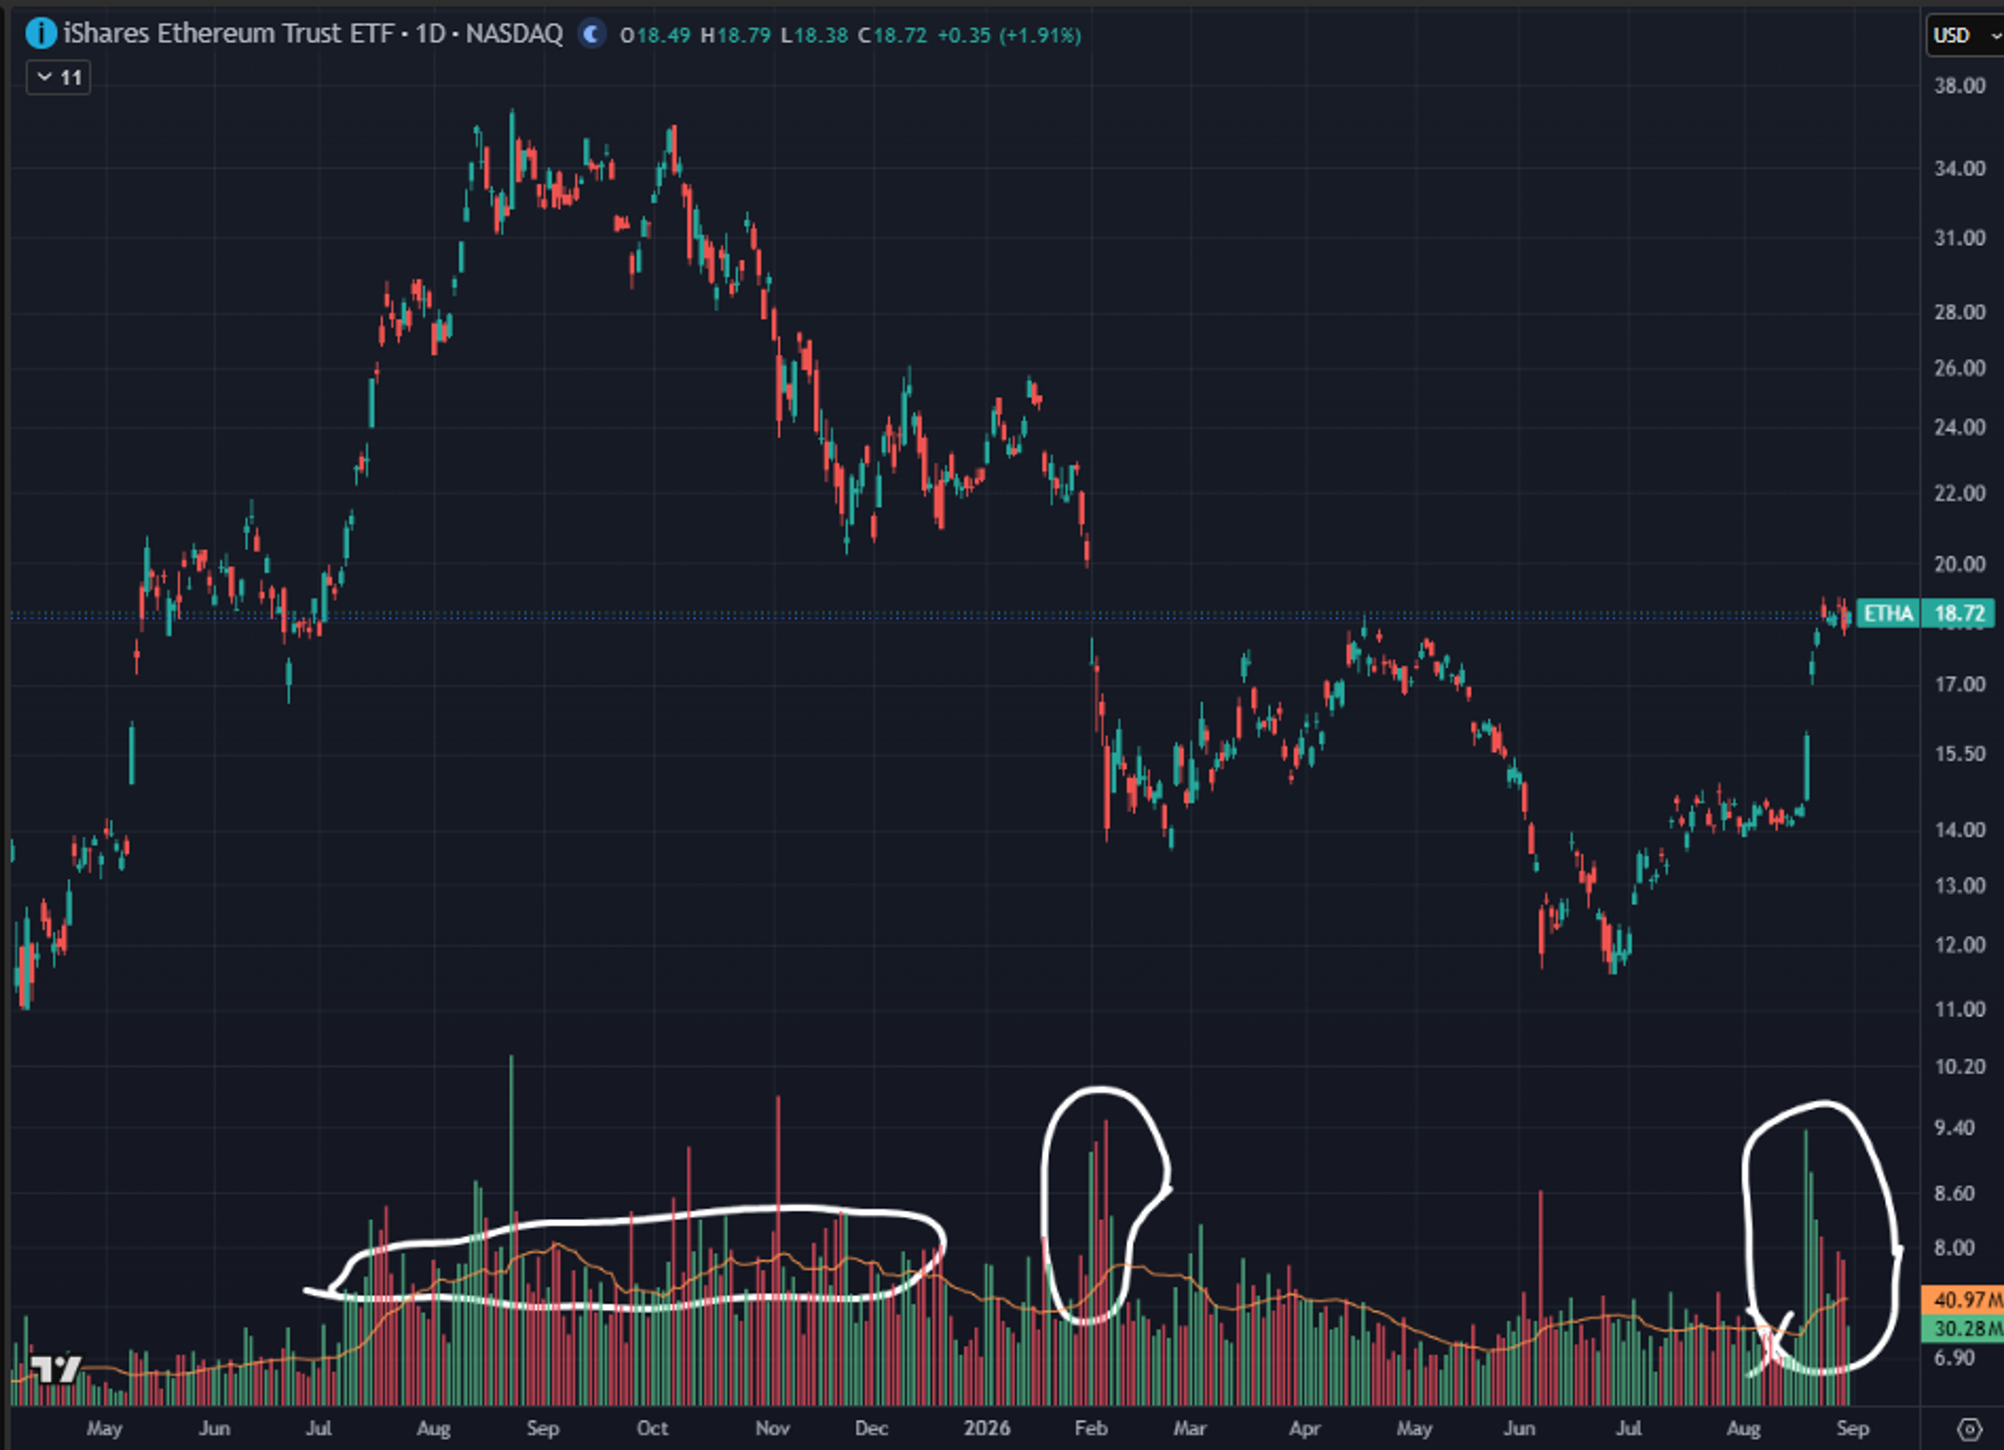
Source: TradingView. As of 8/31/26.
Certainly a very notable volume spike in ETHA against very low volumes. Note that big, sustained pickup in volume in 2H-25. That was after BMNR and all the DATs launched. Those goofy things were driving lots of ETHA trading. So you can see that ETHA volumes had really declined a lot from those levels by August 2026. And then we got a big volume spike, comparable to Feb 2026.
MSTR has had a strong volume push, as Saylor has issued billions of equity-
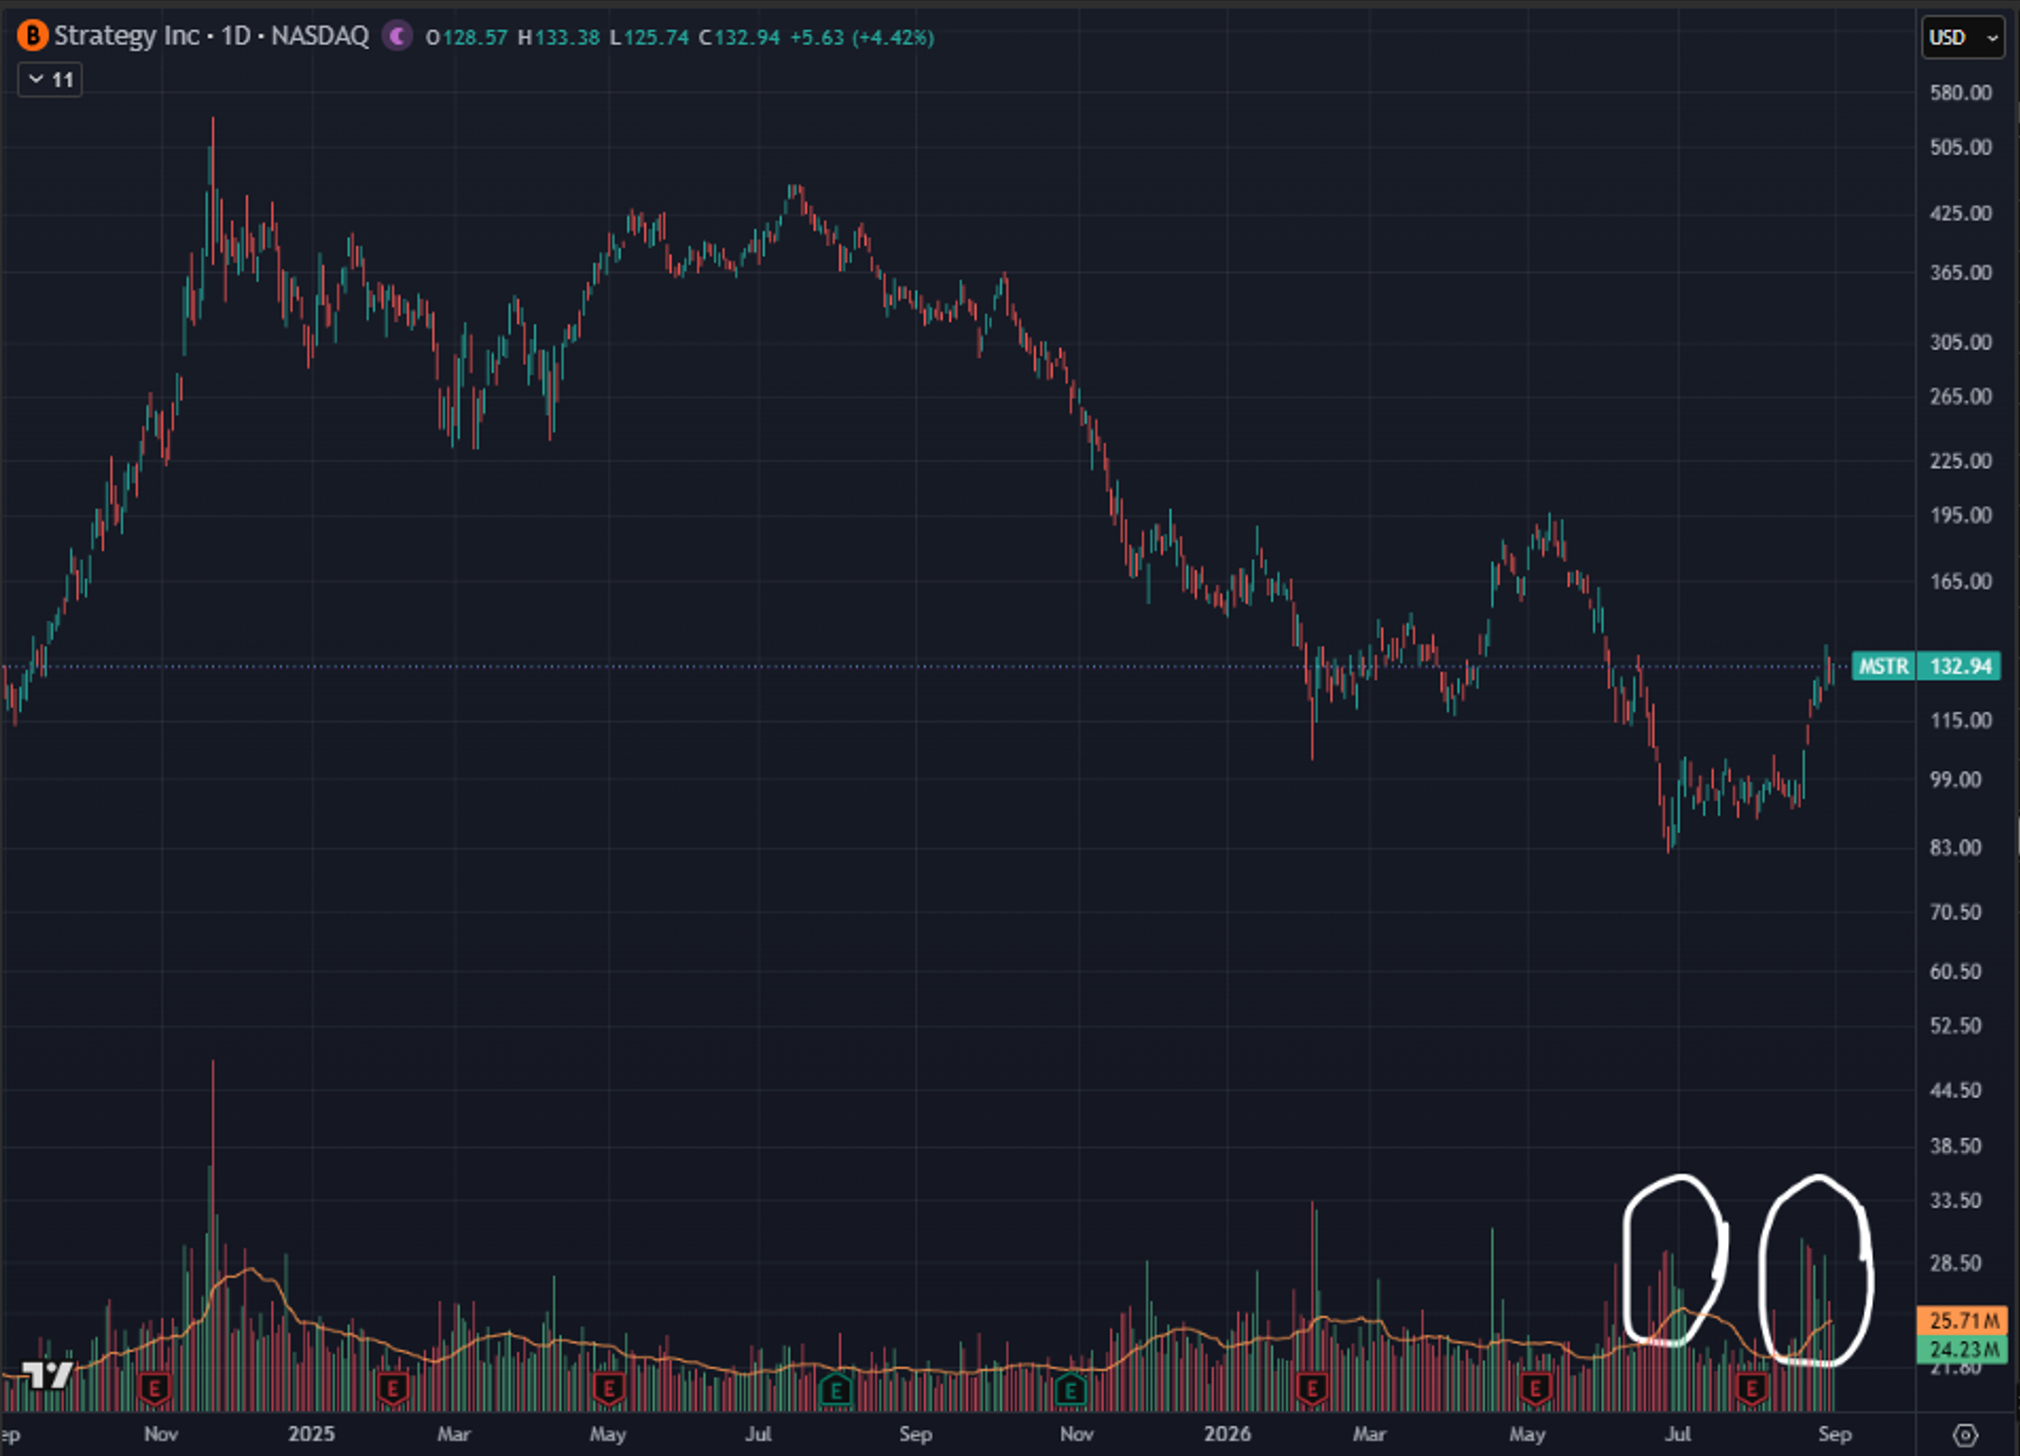
Source: TradingView. As of 8/31/26.
That’s a big price jump too- +60% from the late June lows. It is noteworthy that today, 8/31, MSTR announced the purchase of $370mm of BTC. This is MSTR’s first BTC purchase in nine weeks. Both BTC and MSTR have traded ok since the announcement.
I think it’s a terrible idea for Saylor to be buying BTC. I think he should never buy any BTC again. But that’s not what we’re going to get. At least he’s built a big cash cushion at this point though. Hopefully he doesn’t blow through it again.
Below is BMNR. Big volume push but now declining back to previously depressed levels-
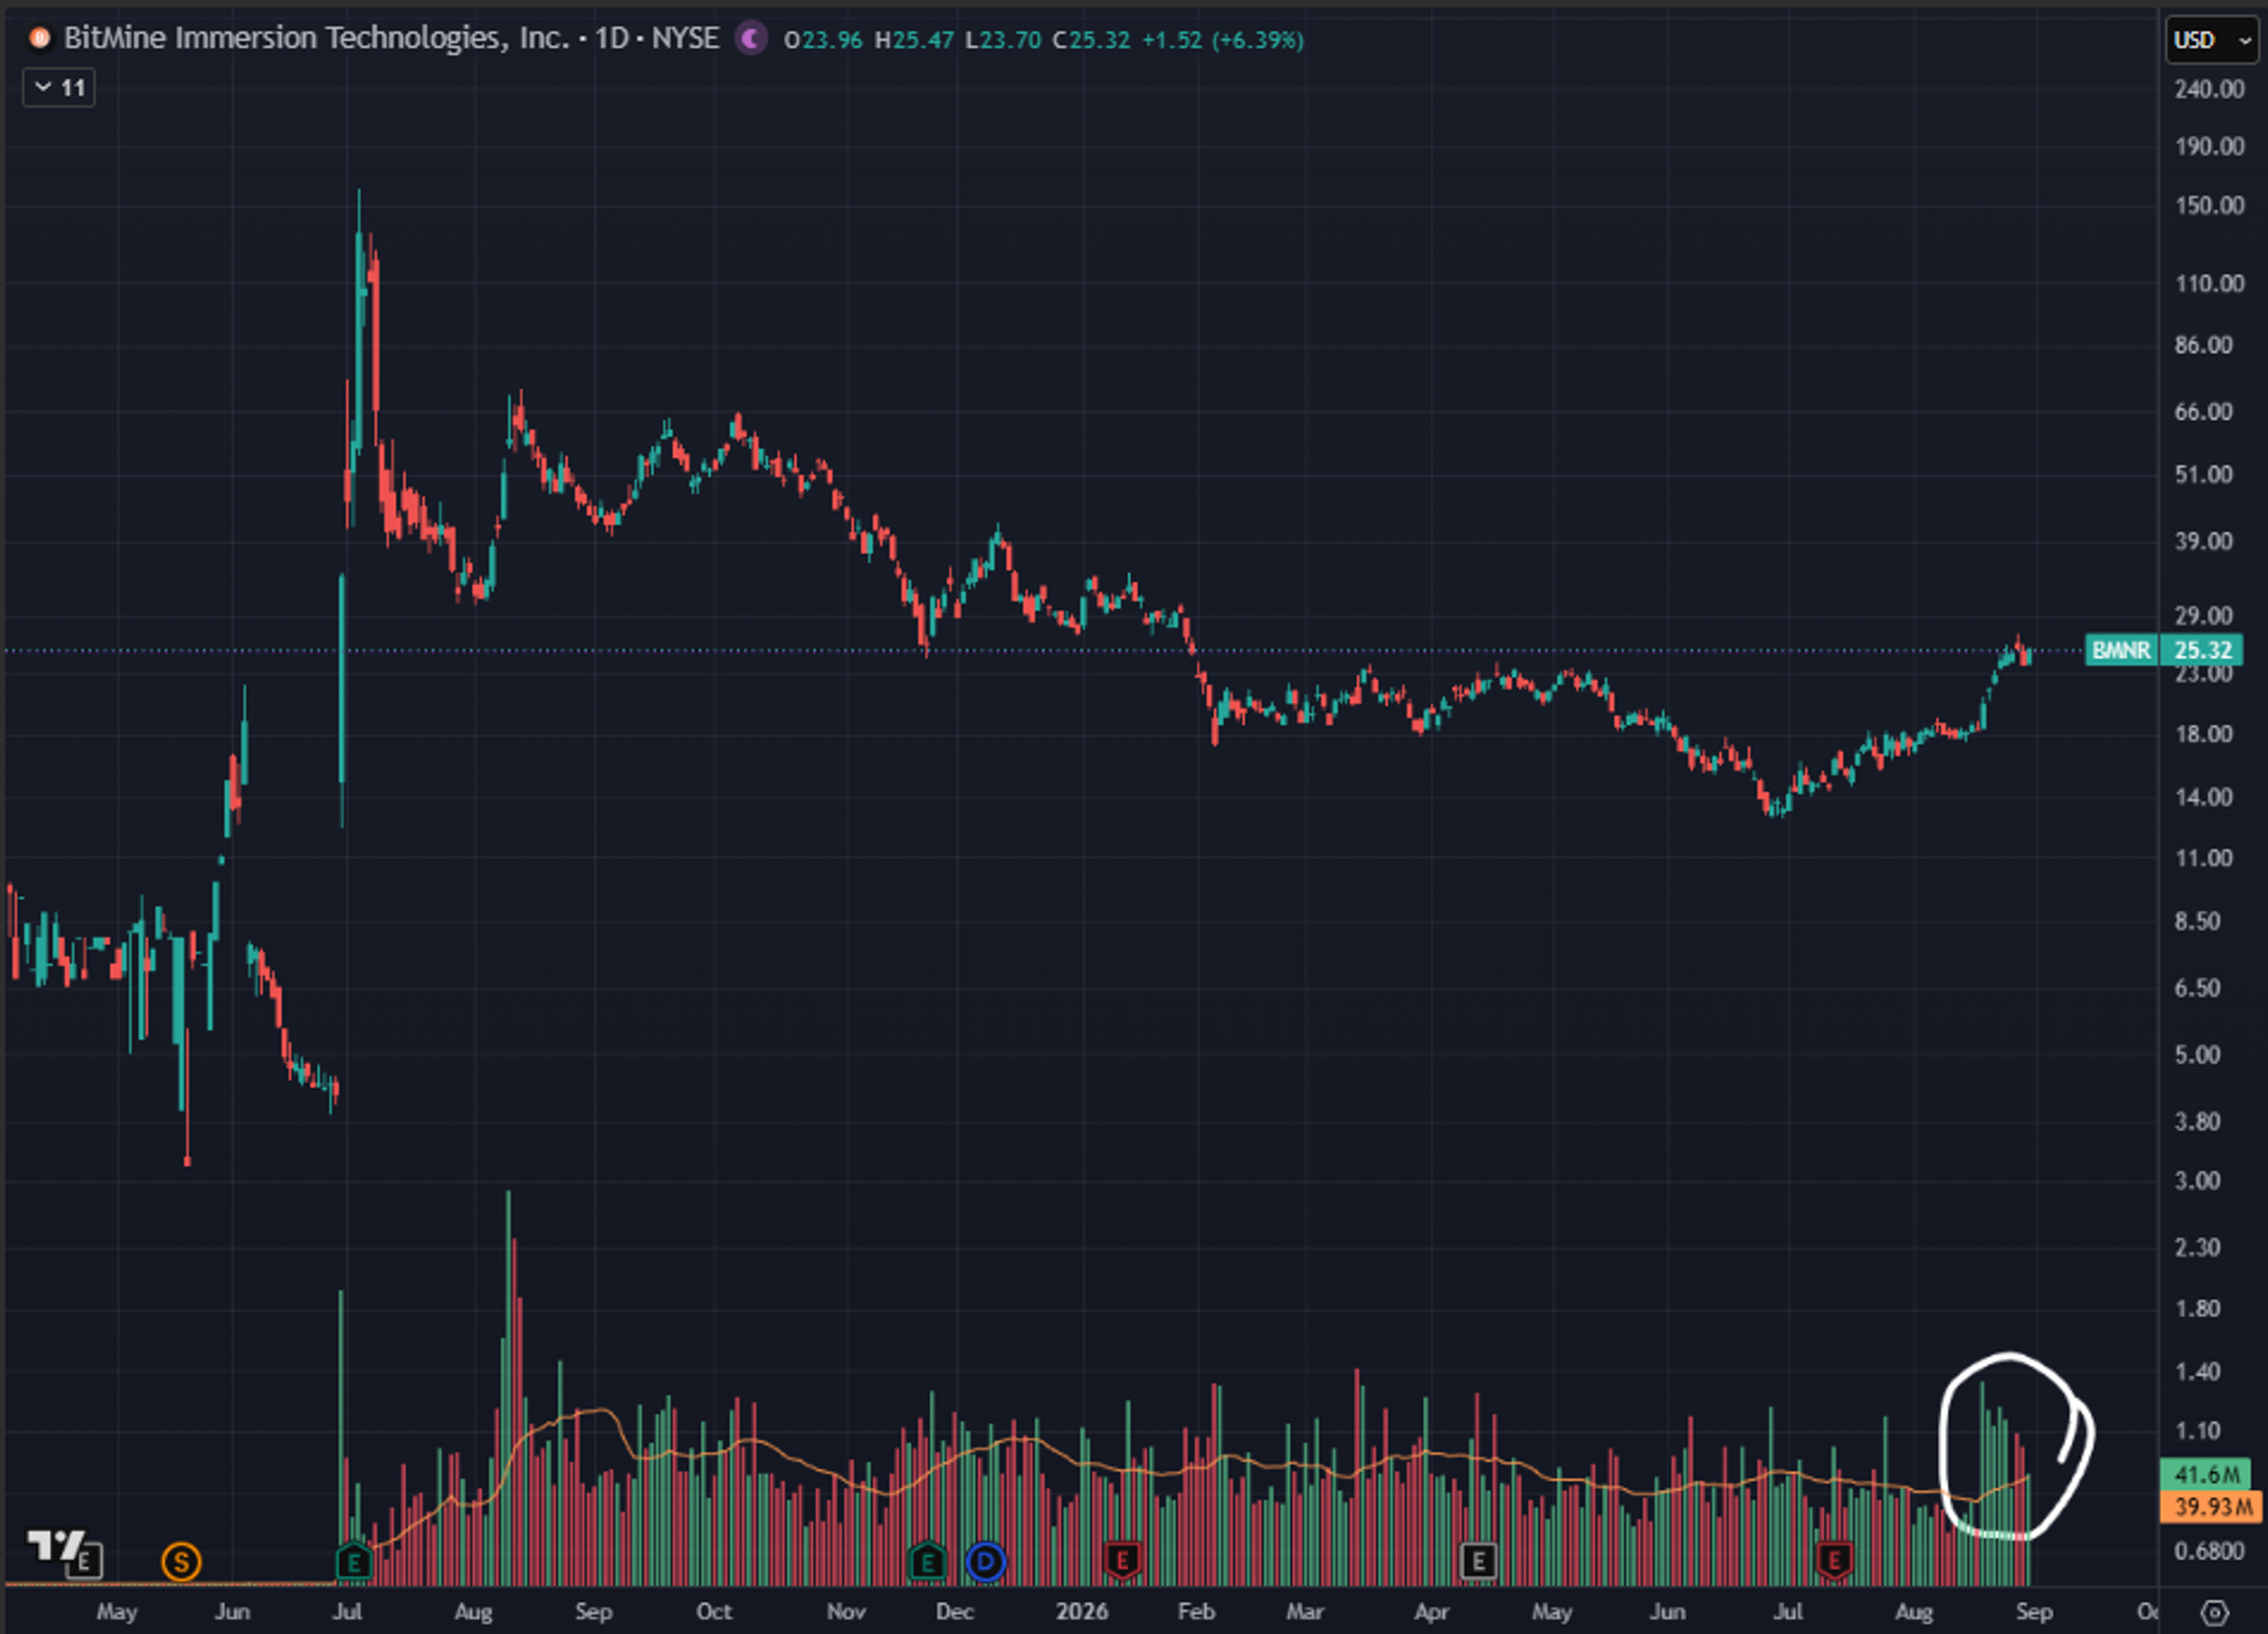
Source: TradingView. As of 8/31/26.
Below is CME BTC OI-
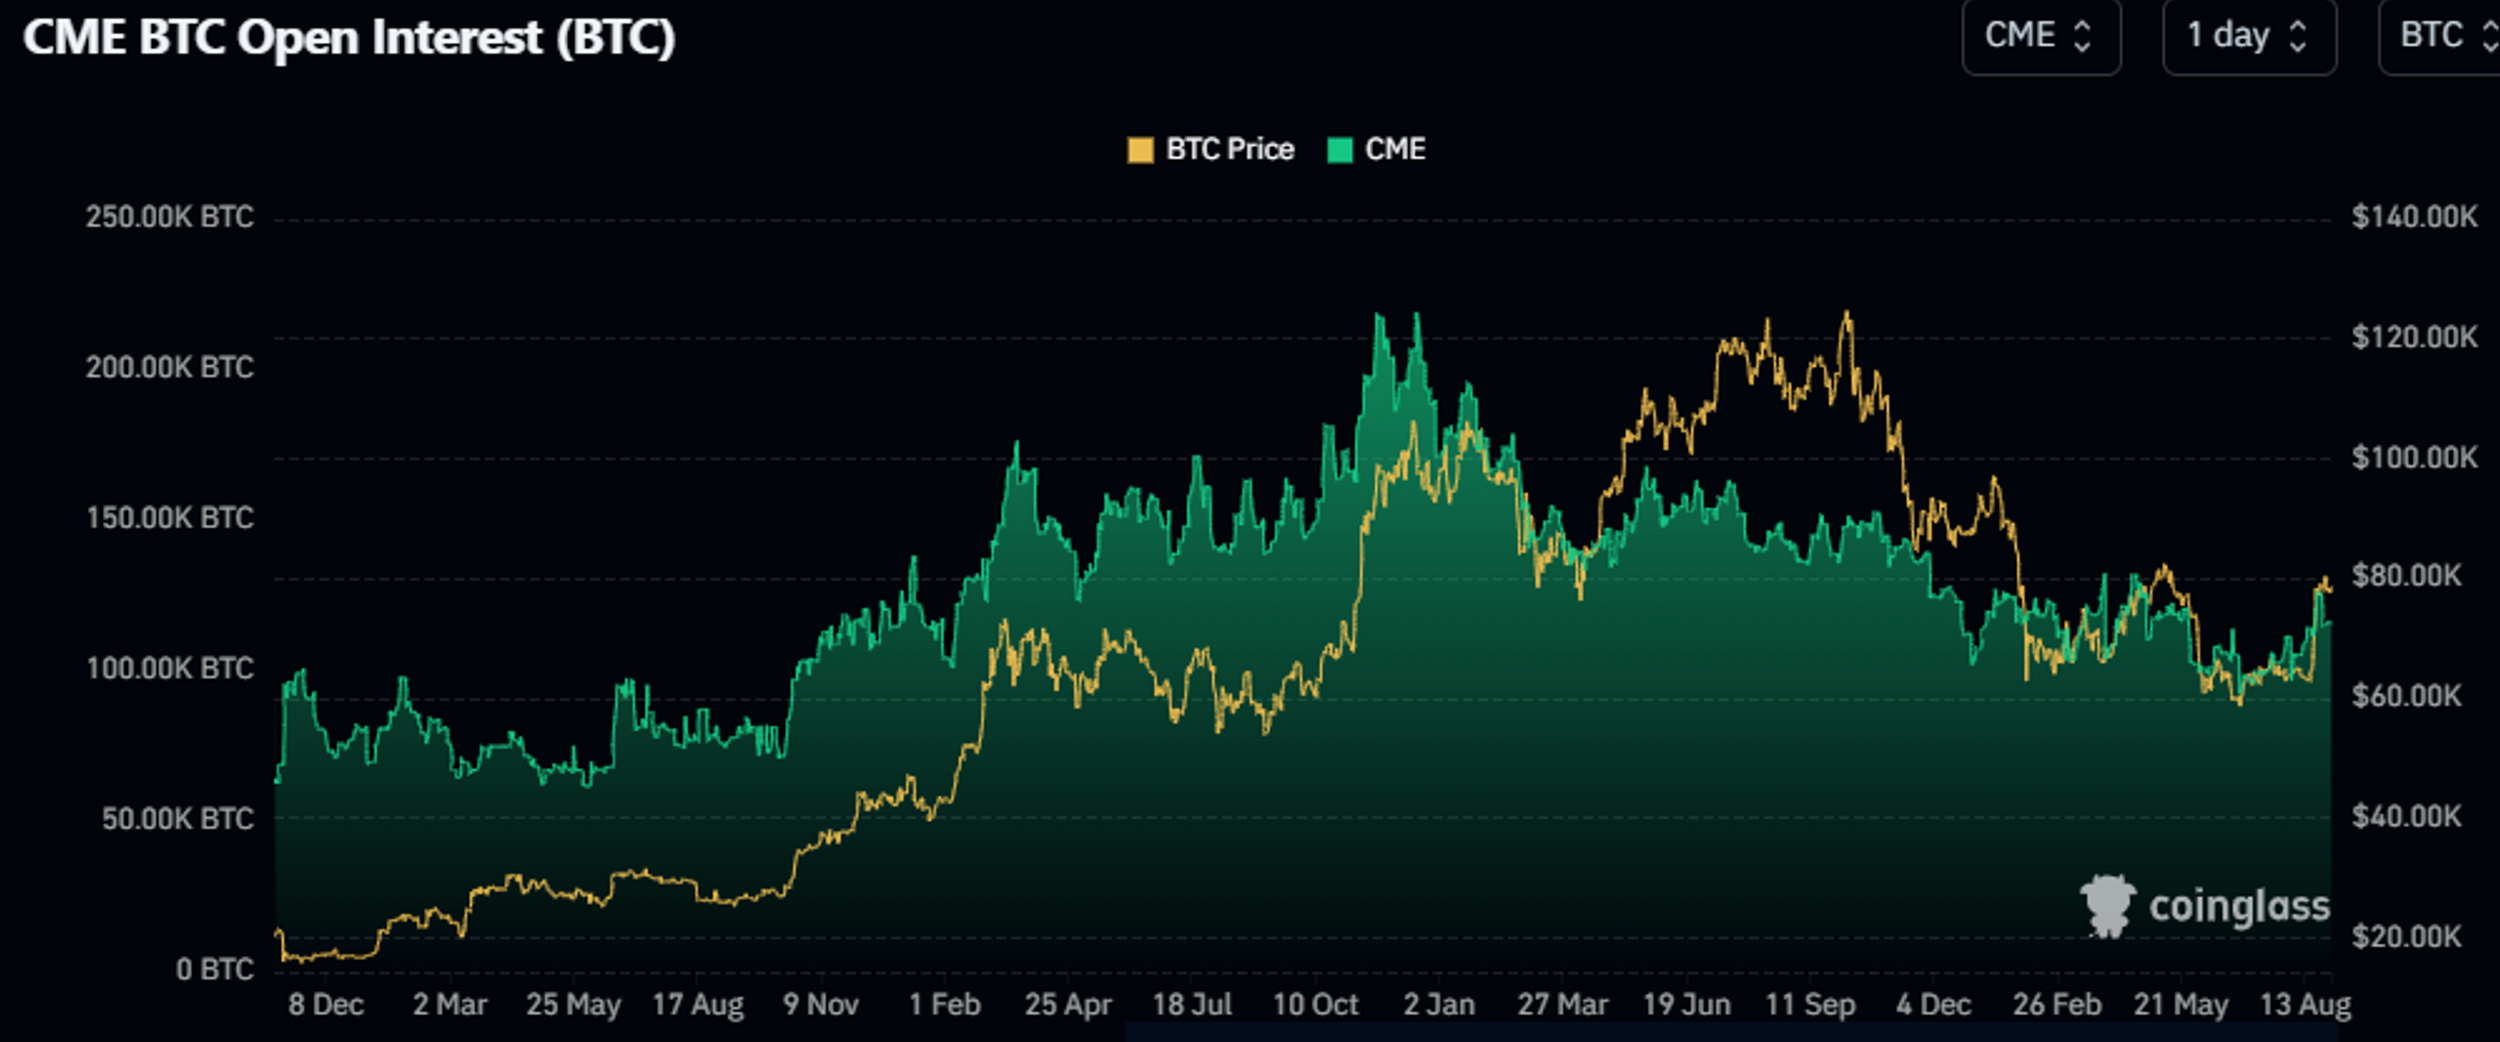
Source: CoinGlass. As of 8/31/26.
I would say there is lots of room for additional buying from current levels. But you could also view it as apathy from the broader market.
ETF flows were very strong in the back of August. A major reversal of the YTD net outflows.
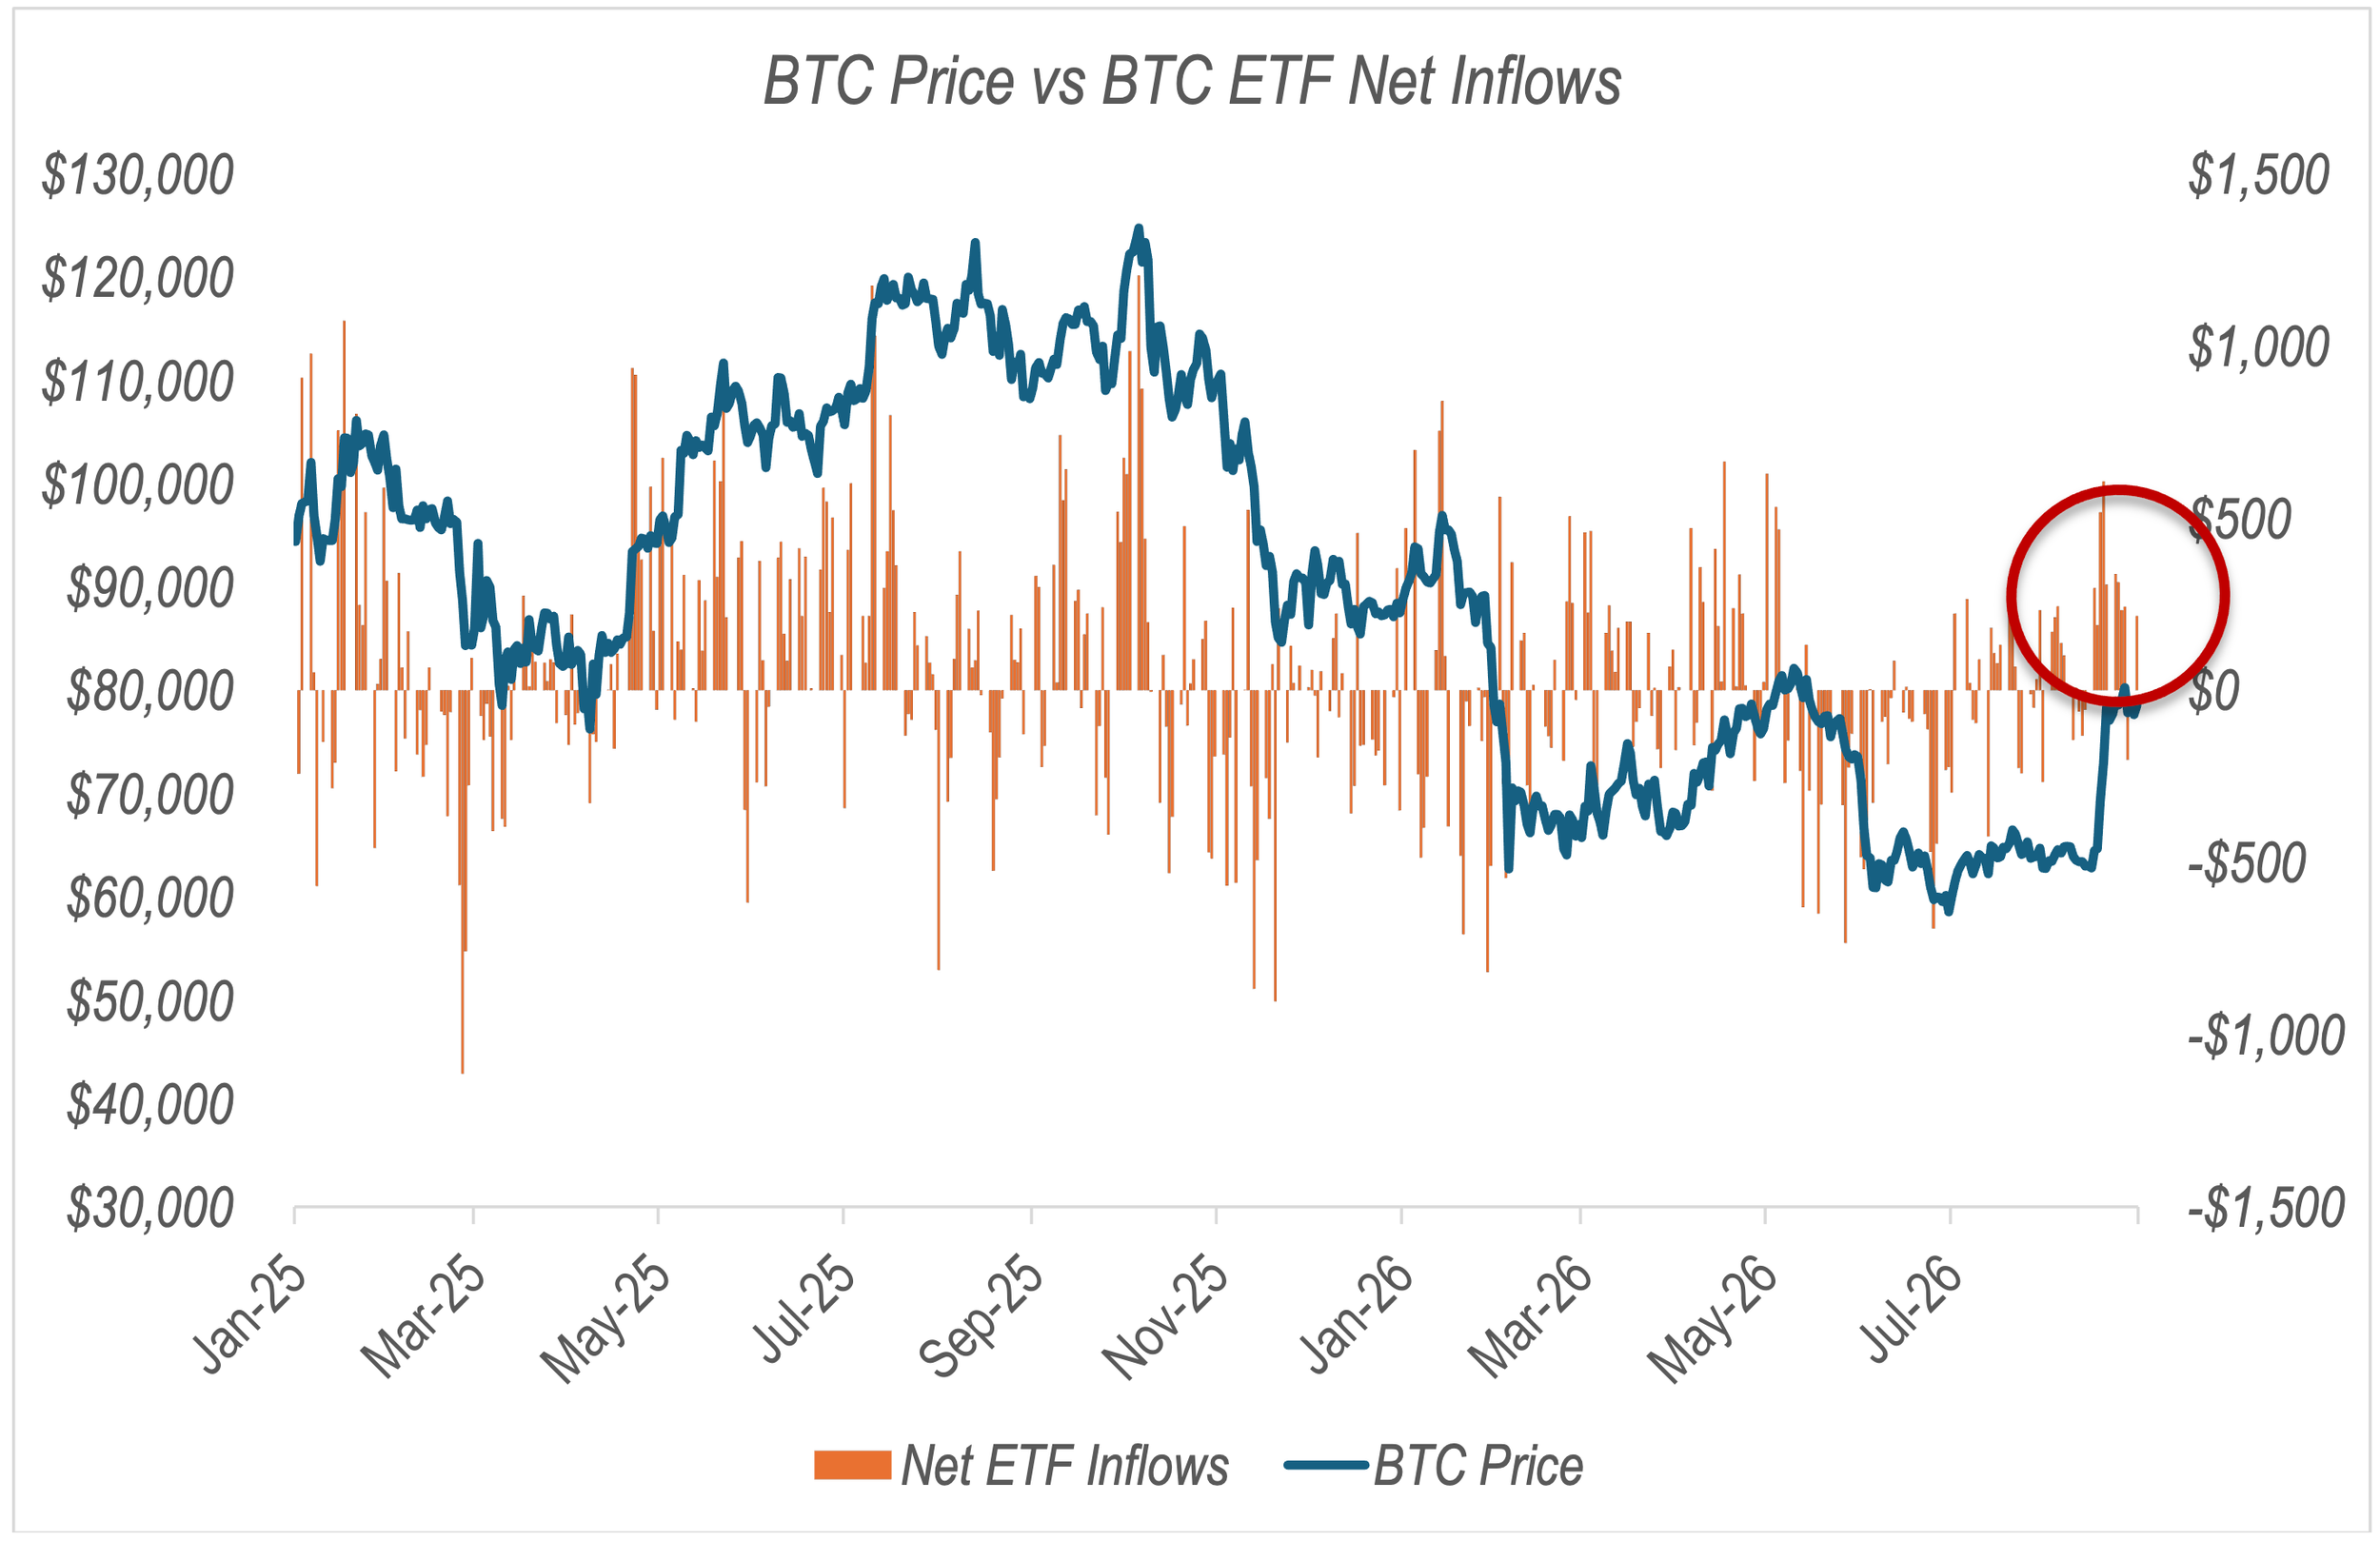
Source: farside.co.uk. As of 8/31/26.
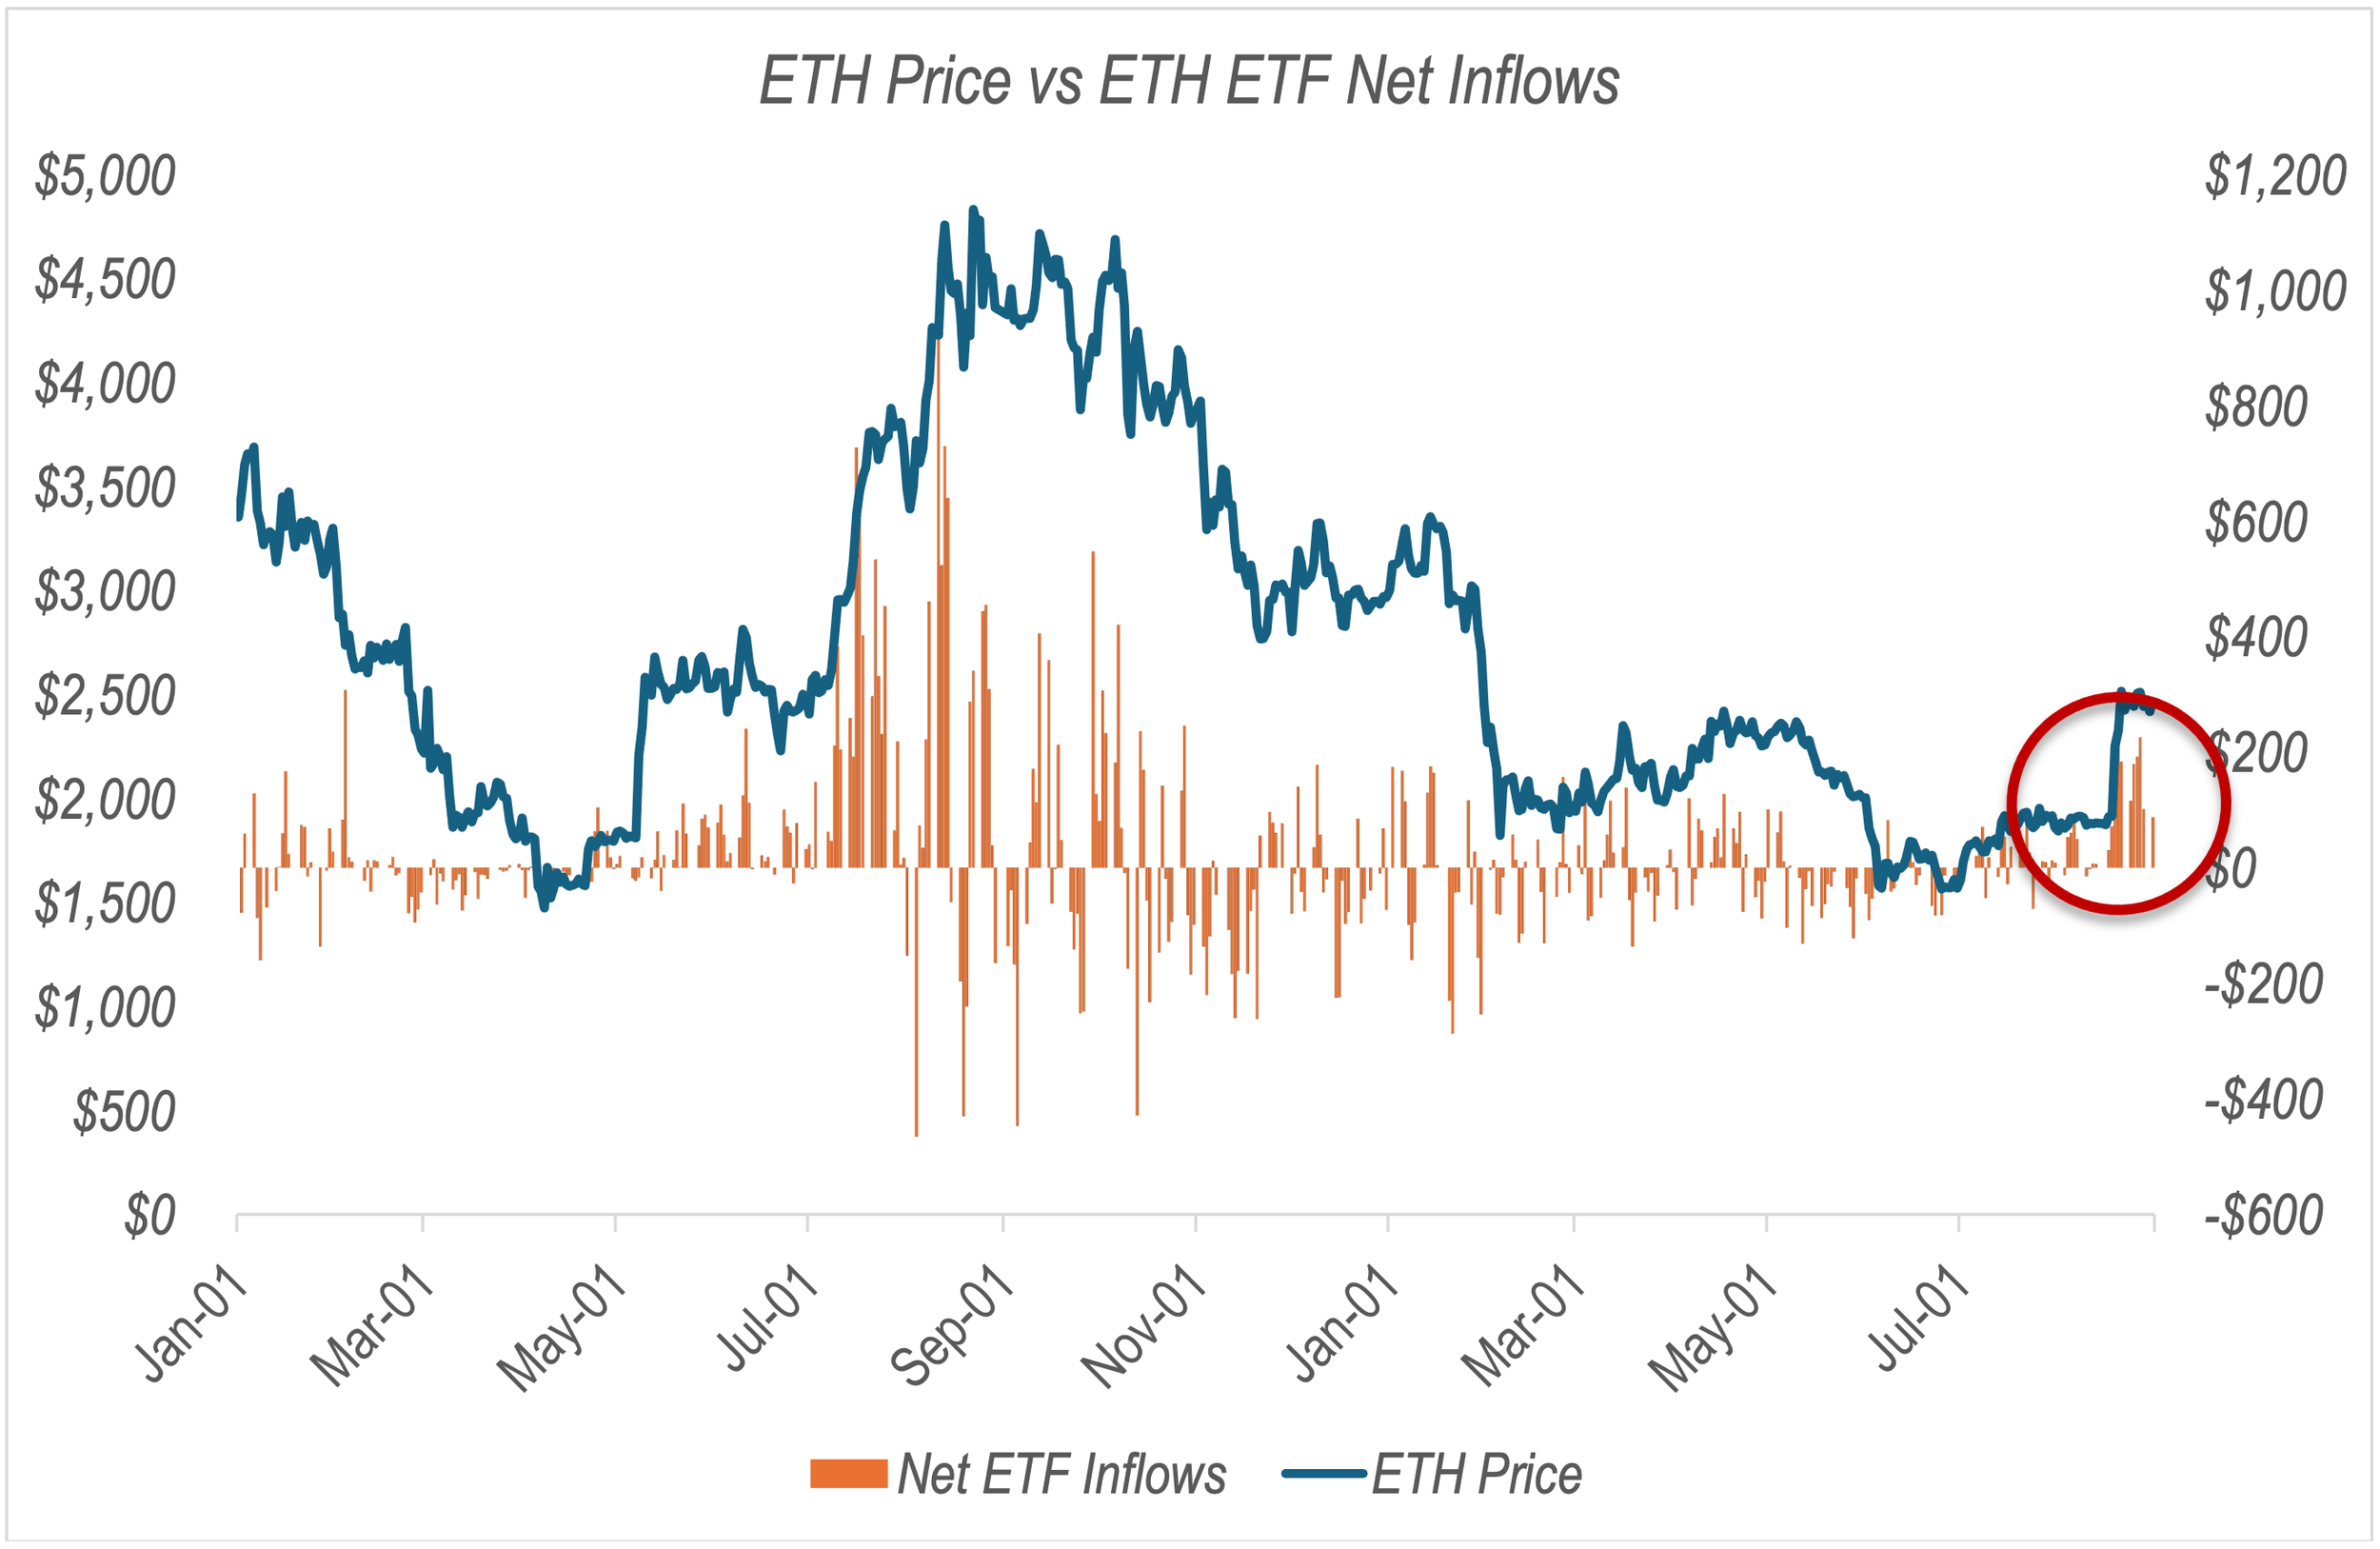
Source: farside.co.uk. As of 8/31/26.
So you have induced a good amount of inflows into the ETFs, although it is worth mentioning that a lot of those inflows came towards the end of the month after BTC and ETH prices had already topped. So it’s a bit hard to glean exactly what’s going to happen with BTC/ETH price just from looking at ETF flows.
So What?
The fund had zero exposure to BTC/crypto for the August pump. We were long some ETHA puts but sold them for a profit before the pump – so we had no exposure either way. That’s been a bit painful for relative performance in August (and July before that), but the decision overall to move in the direction of AIVC and away from crypto has still been a good one for the fund YTD.
All of that to say, the fund has plenty of room to add BTC/crypto exposure if we want. It’s certainly still part of our mandate. But so far, I haven’t been able to bring myself to buy any. I haven’t been convinced by the follow-through so far. And as I’ve tried to explain here, I think the conditions under which the squeeze occurred in the first place are not necessarily still in place.
Frankly, I’m more likely to be looking for crypto shorts than longs from here. If what we just experienced was the cyclical bottom and we’re going much higher from here, that will be a bottom unlike any other bottom in BTC history. And perhaps that’s possible. In the ETF era, we’ve already had some “4-year cycle” type rules that have broken. Perhaps this cyclical bottom we just experienced will break some more of those rules.
But I struggle to have that as my base case right here. I might be forced to buy higher. We’ll see.
Market Update— Liquid Markets Investing
| Name | August | July | Q2-26 | Q1-26 | YTD | Q4-25 | Q3-25 | Q2-25 | Q1-25 | 2025 | 2024 | Instrument |
|---|---|---|---|---|---|---|---|---|---|---|---|---|
| S&P 500 | 3% | 0% | 15% | -5% | 12% | 2% | 8% | 11% | -5% | 16% | 23% | SPX |
| NASDAQ-100 | 4% | -7% | 28% | -6% | 17% | -6% | 2% | 18% | -8% | 20% | 25% | QQQ |
| Magnificent Seven | 4% | 3% | 11% | -12% | 4% | -4% | 12% | 23% | -8% | 29% | 42% | MAGS |
| Bitcoin | 25% | 7% | -14% | -22% | -10% | -23% | 6% | 30% | -12% | -6% | 121% | BTC |
| Ethereum | 33% | 19% | -25% | -29% | -17% | -28% | 67% | 36% | -45% | -11% | 46% | ETH |
| Solana | 42% | -1% | -12% | -33% | -17% | -35% | 48% | 42% | -52% | -19% | 312% | SOL |
| BNB | 18% | 7% | -12% | -29% | -20% | -14% | 53% | 9% | -14% | 23% | 124% | BNB |
| Hyperliquid | 60% | -19% | 77% | 44% | 230% | -22% | 81% | 67% | -38% | 45% | n/a | HYPE |
| Aggregate Mkt Cap | 22% | 5% | 10% | -2% | -11% | -24% | 16% | 24% | -19% | -11% | 136% | TOTAL |
| Aggr Alts Mkt Cap (ex top-10) | 24% | -6% | -13% | -18% | -15% | -24% | 34% | 25% | -34% | -16% | 72% | OTHERS |
| Semiconductors | 1% | -21% | 95% | 9% | 70% | -8% | 15% | 28% | -12% | 32% | 49% | SOXX |
| Expanded Tech Software | 16% | 4% | 13% | -24% | 4% | -3% | 9% | 16% | -7% | 19% | 22% | IGV |
| ARK Innovation (disruptive tech) | 20% | -12% | 20% | -12% | 11% | -11% | 25% | 31% | -23% | 19% | 38% | ARKK |
| Robotics & AI | 2% | -7% | 14% | -8% | -1% | -8% | 19% | 22% | -15% | 15% | 30% | BOTZ |
| Quantum Computing | 5% | -15% | 54% | -2% | 35% | 7% | 38% | 59% | -31% | 88% | n/a | QTUM |
SOURCE: GROK. AS OF 8/31/26.
BTC and crypto we just covered. So I’ll just hit on a few stock charts.
After consolidating for ~3 months, SPX made new ATHs in Aug. Looks good. Like a flag, retest, hold, continuation. Looks like more ATHs this year-
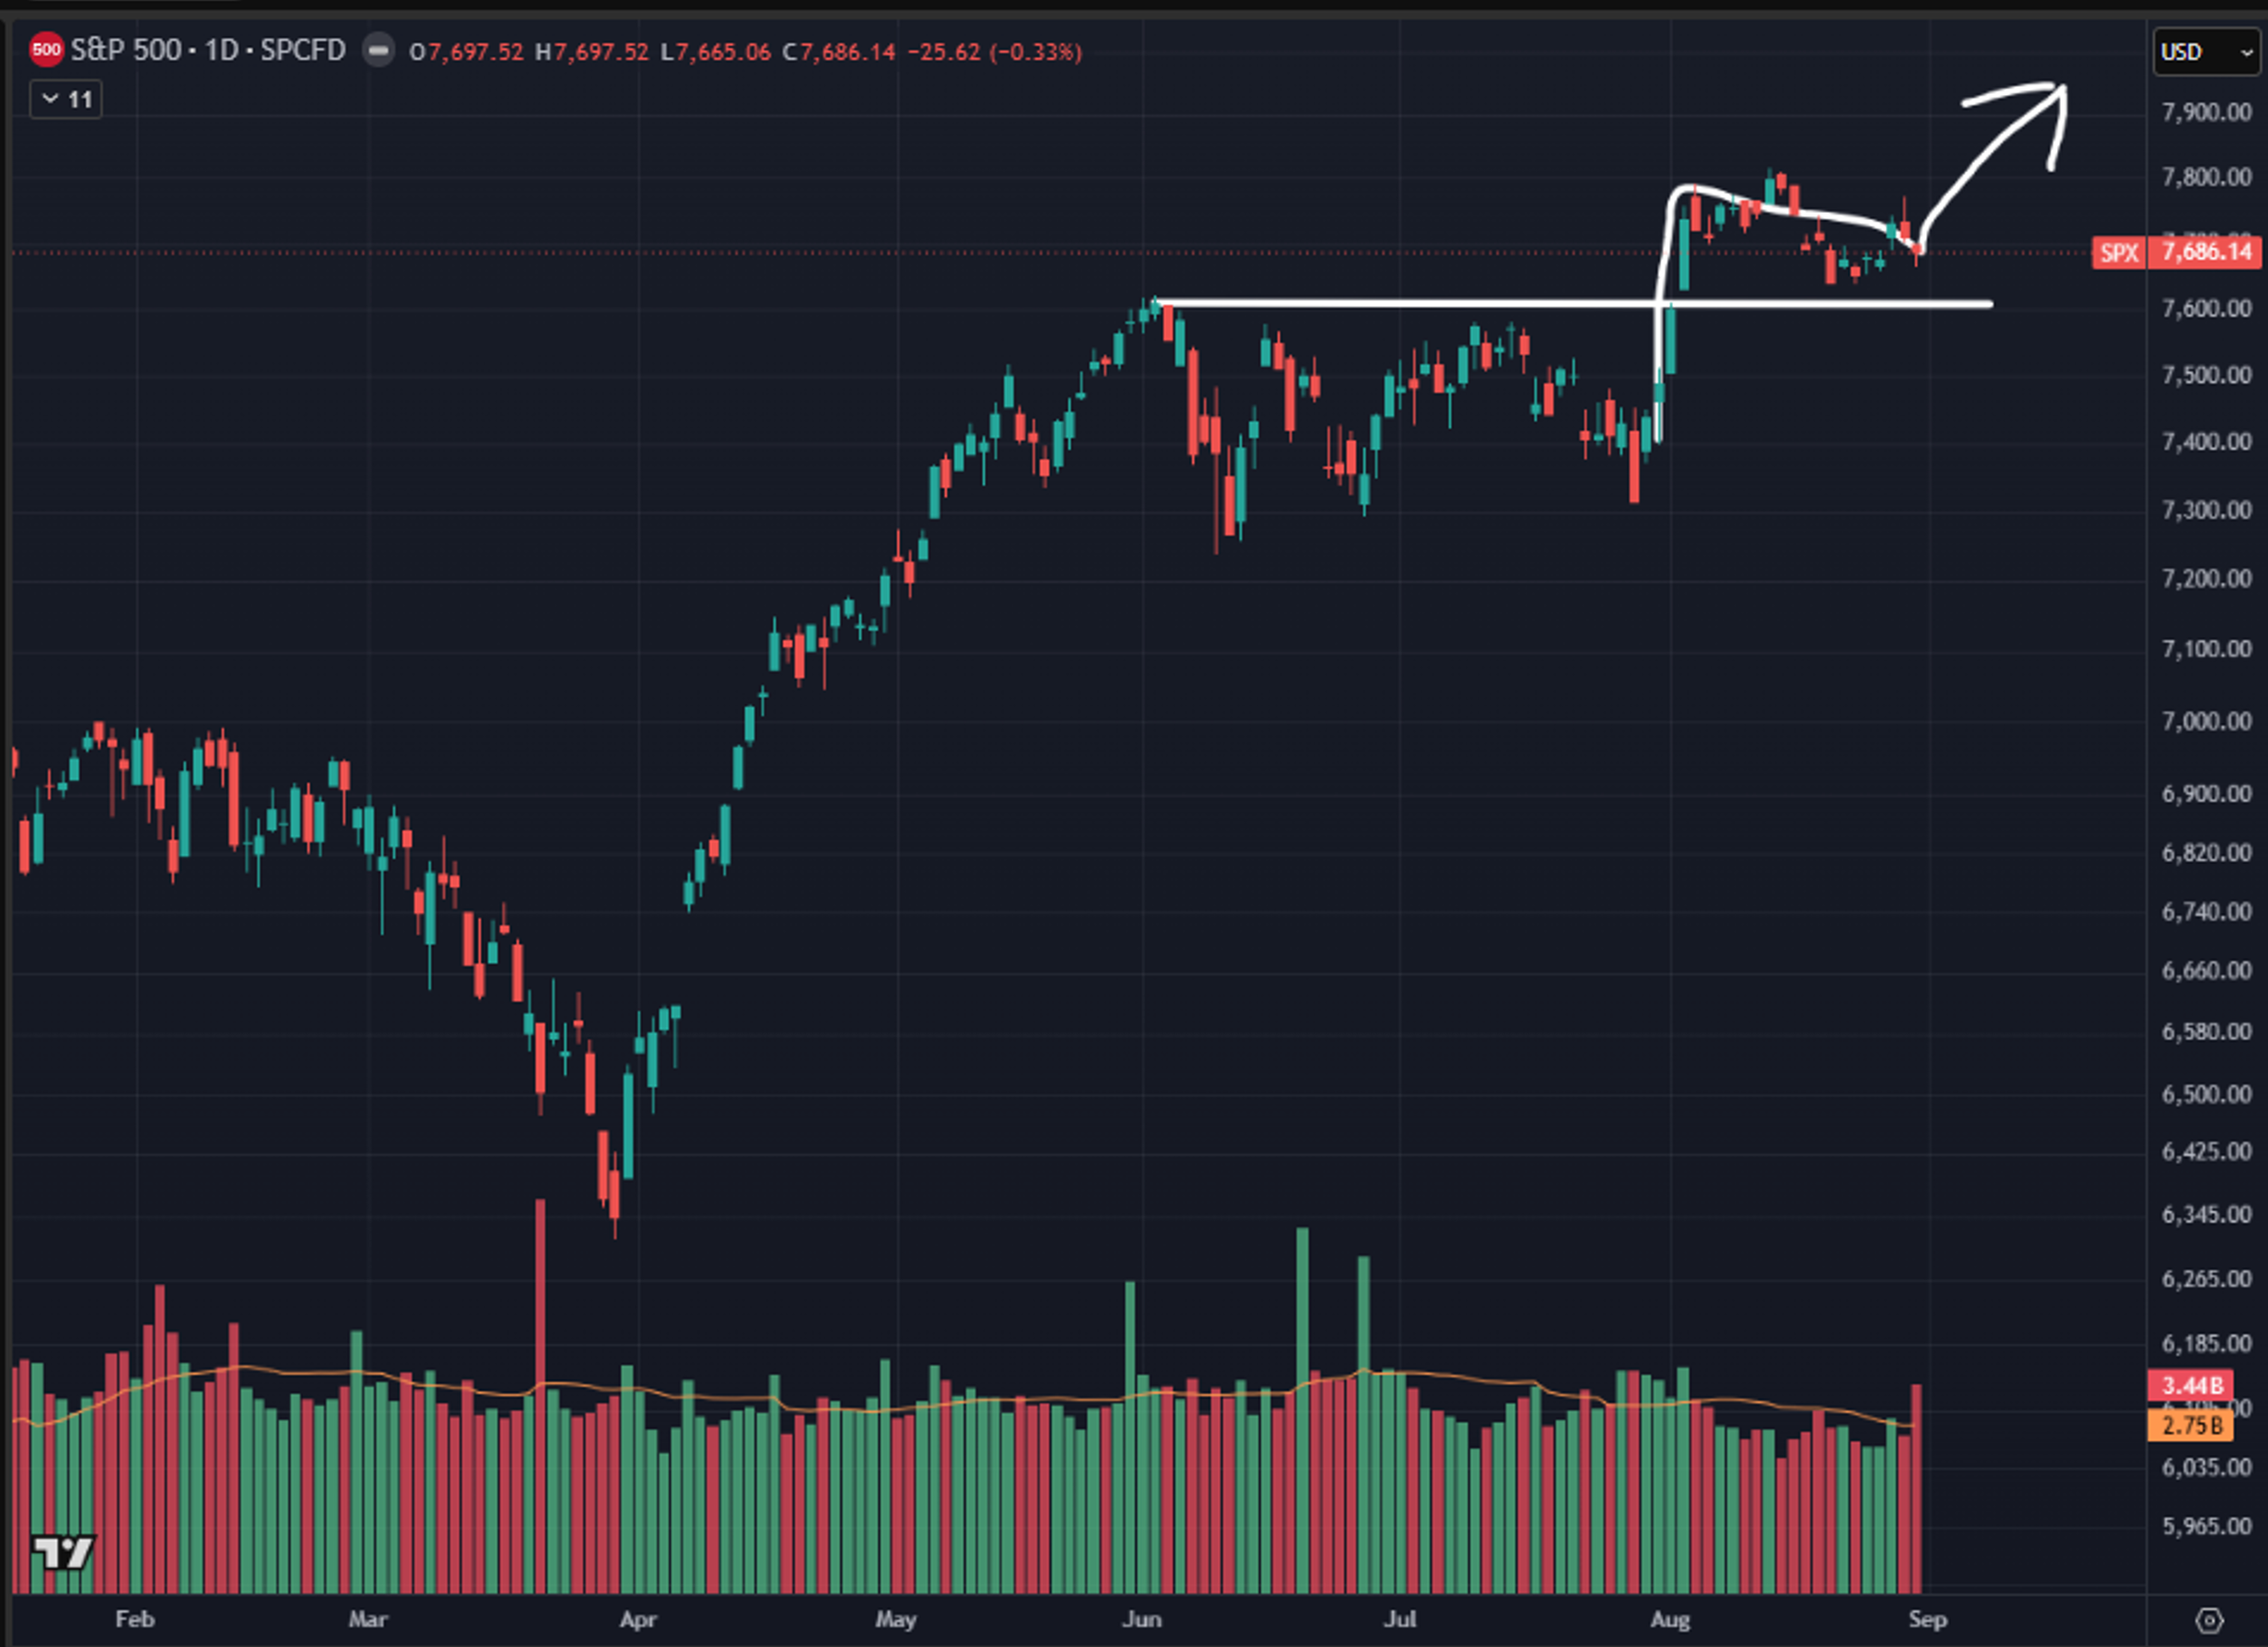
Source: TradingView. As of 8/31/26.
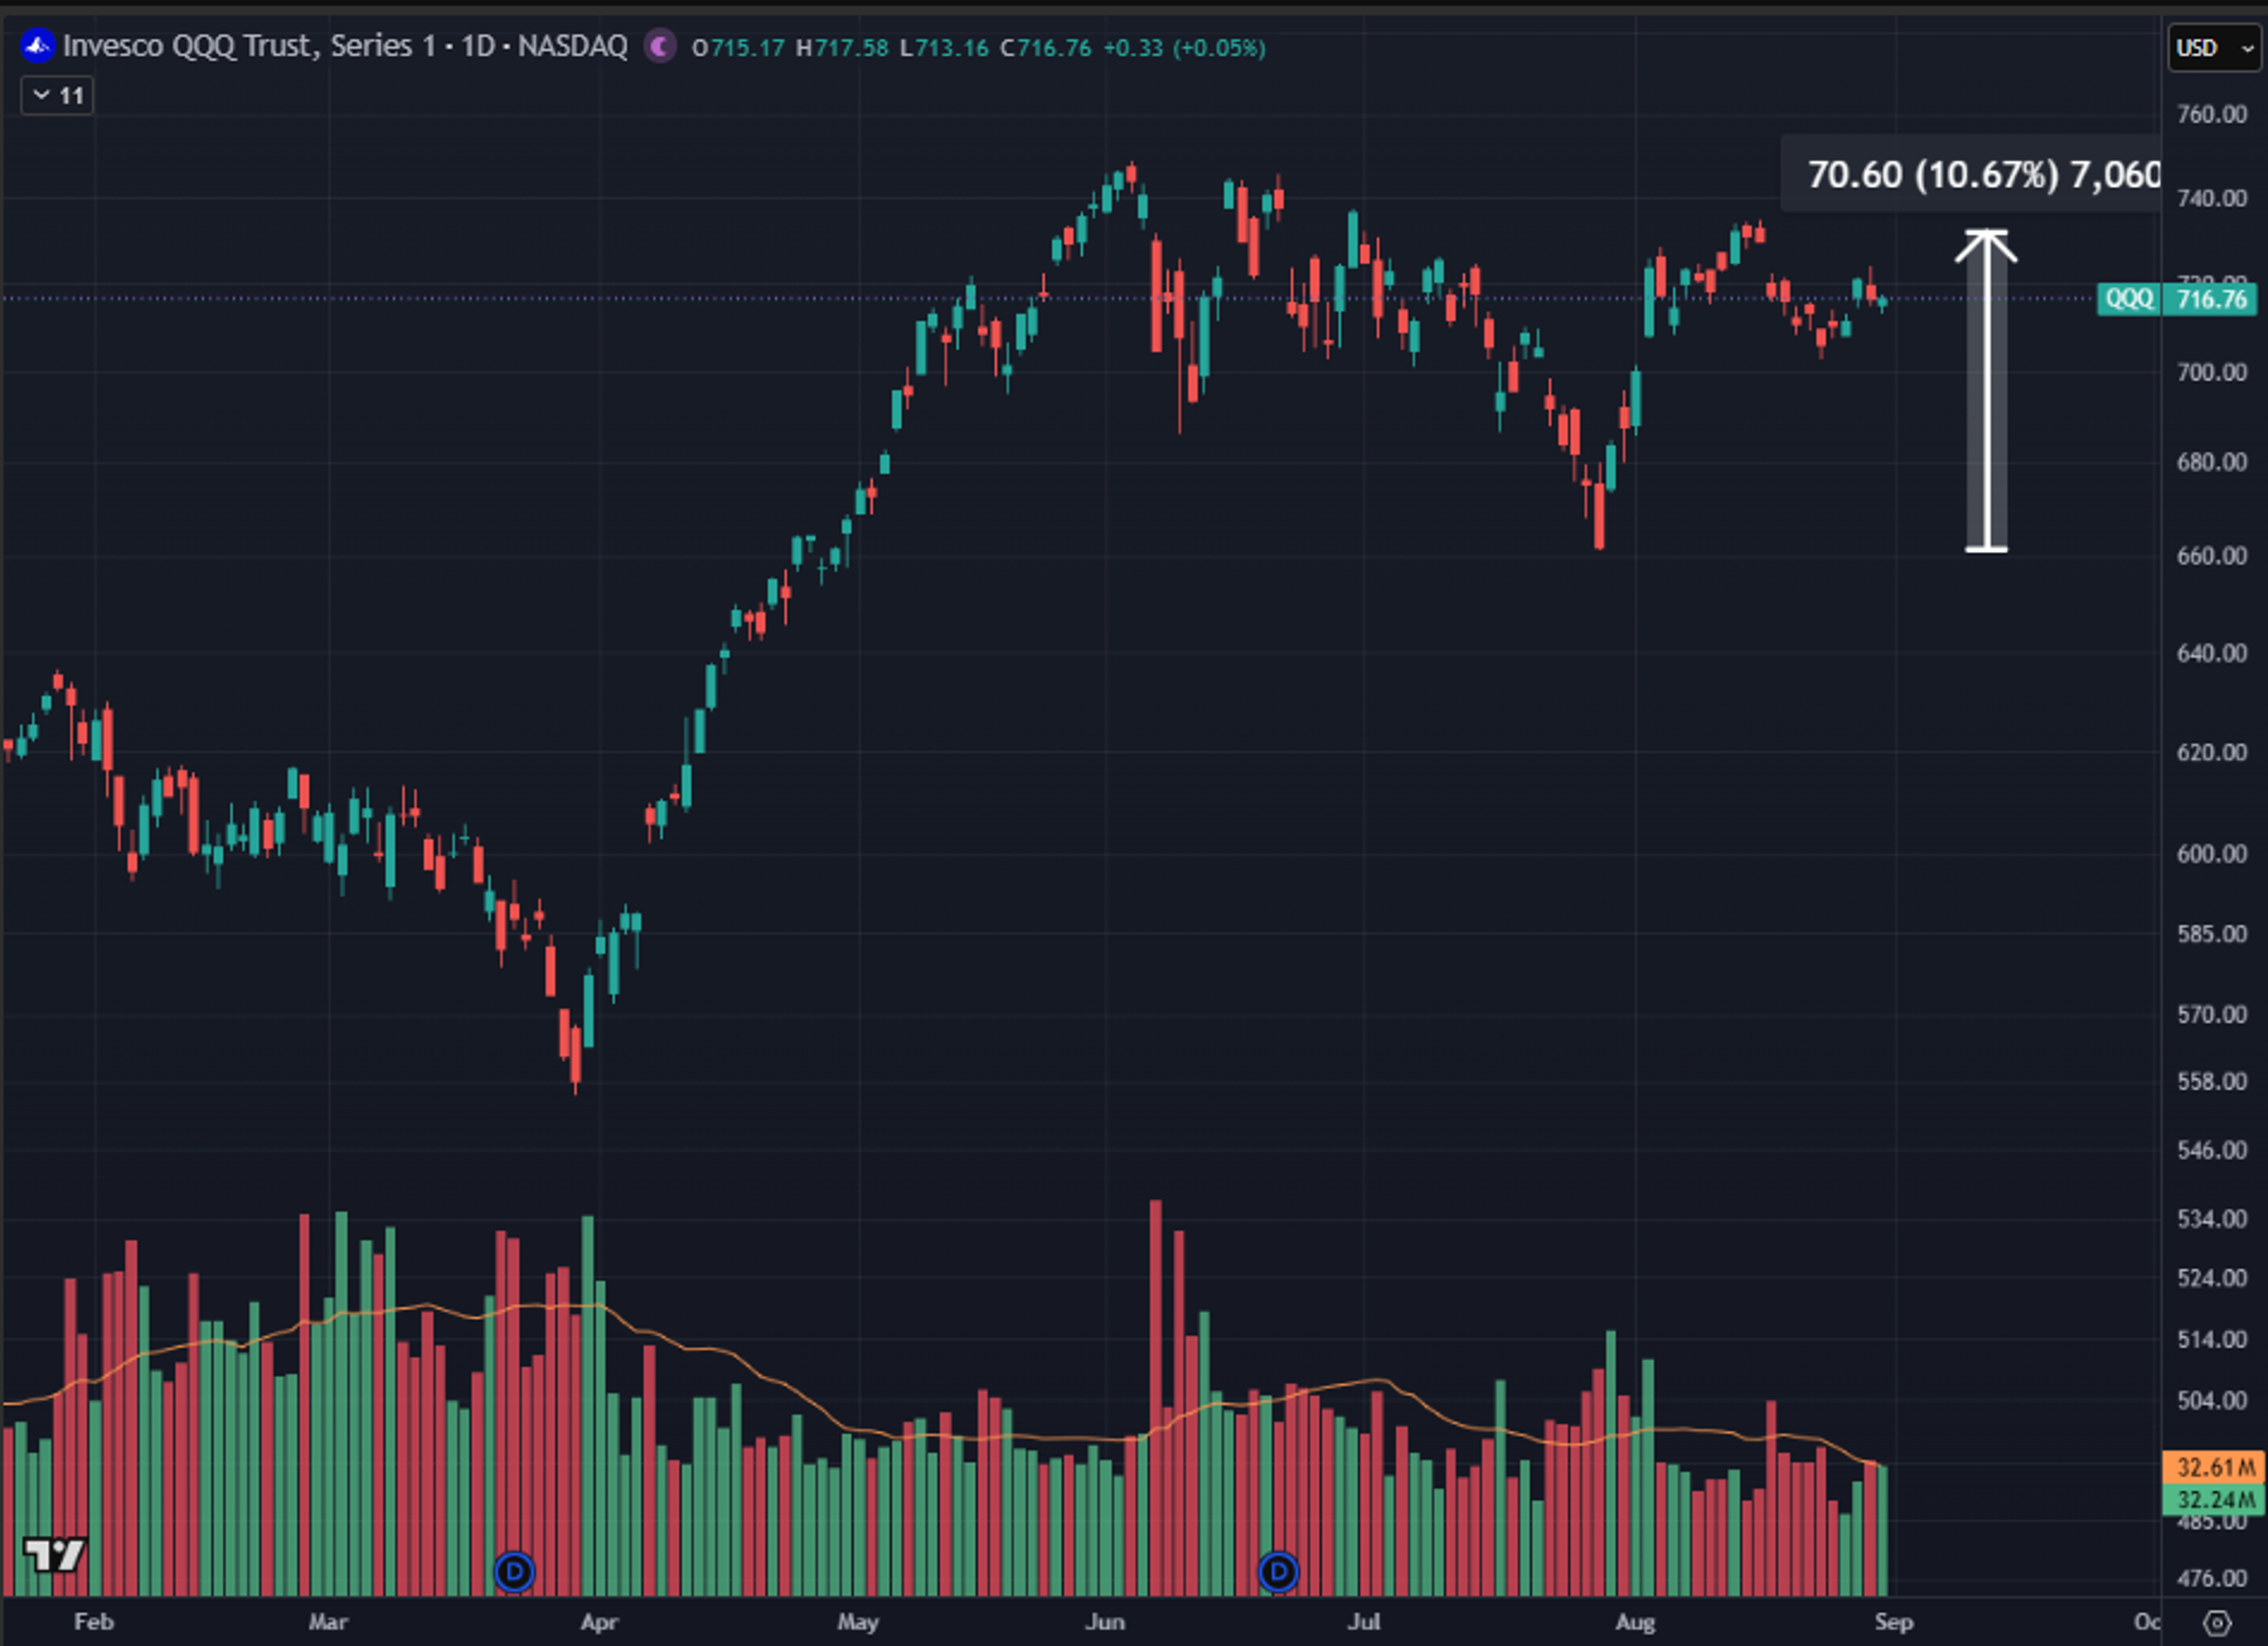
QQQ had a really strong 11% bounce off of Leopold (also getting help from good earnings). Now consolidating below ATH. Looks healthy to me. Looks like new ATHs this year-
Source: TradingView. As of 8/31/26.
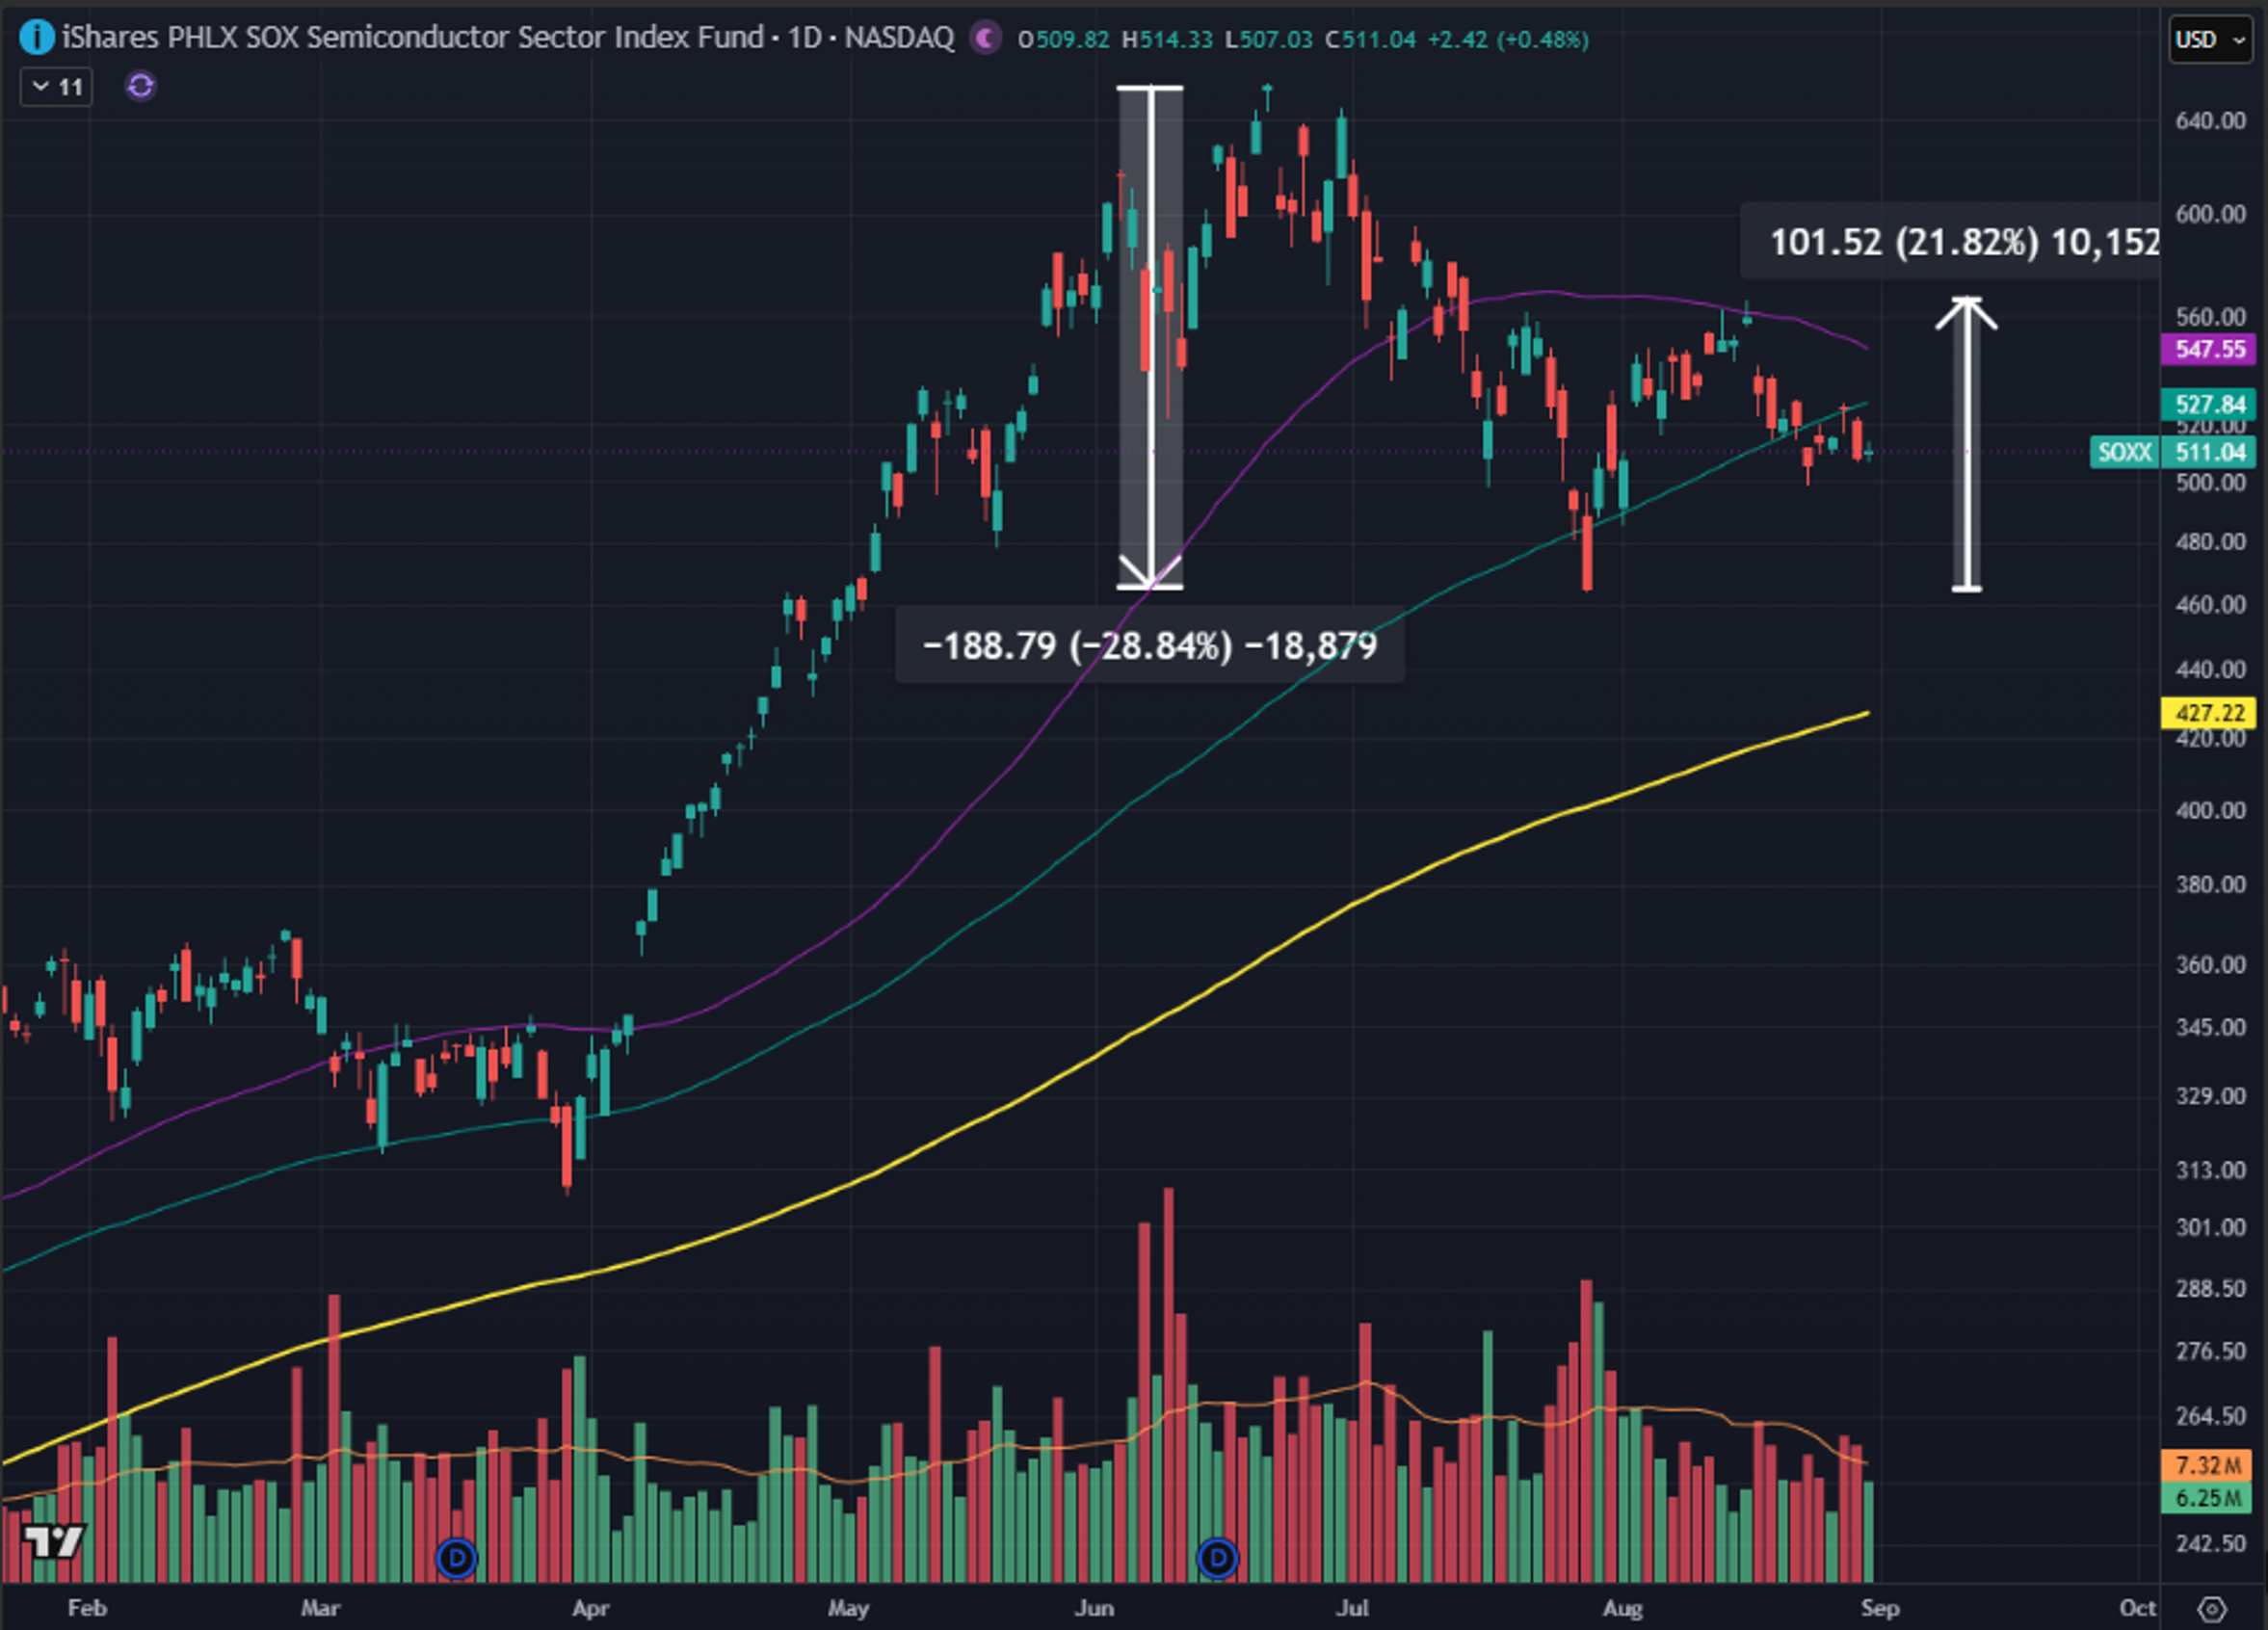
SOXX is a weaker chart than QQQ-
Source: TradingView. As of 8/31/26.
You had an aggressive 29% pullback from the late June highs into the Leopold lows followed by an equally aggressive 22% bounce before giving part of that bounce back. I think SOXX in August was still very much dealing with the ripple effects of Leopold.
One hint of those ripples is this tweet from Aug 21st-
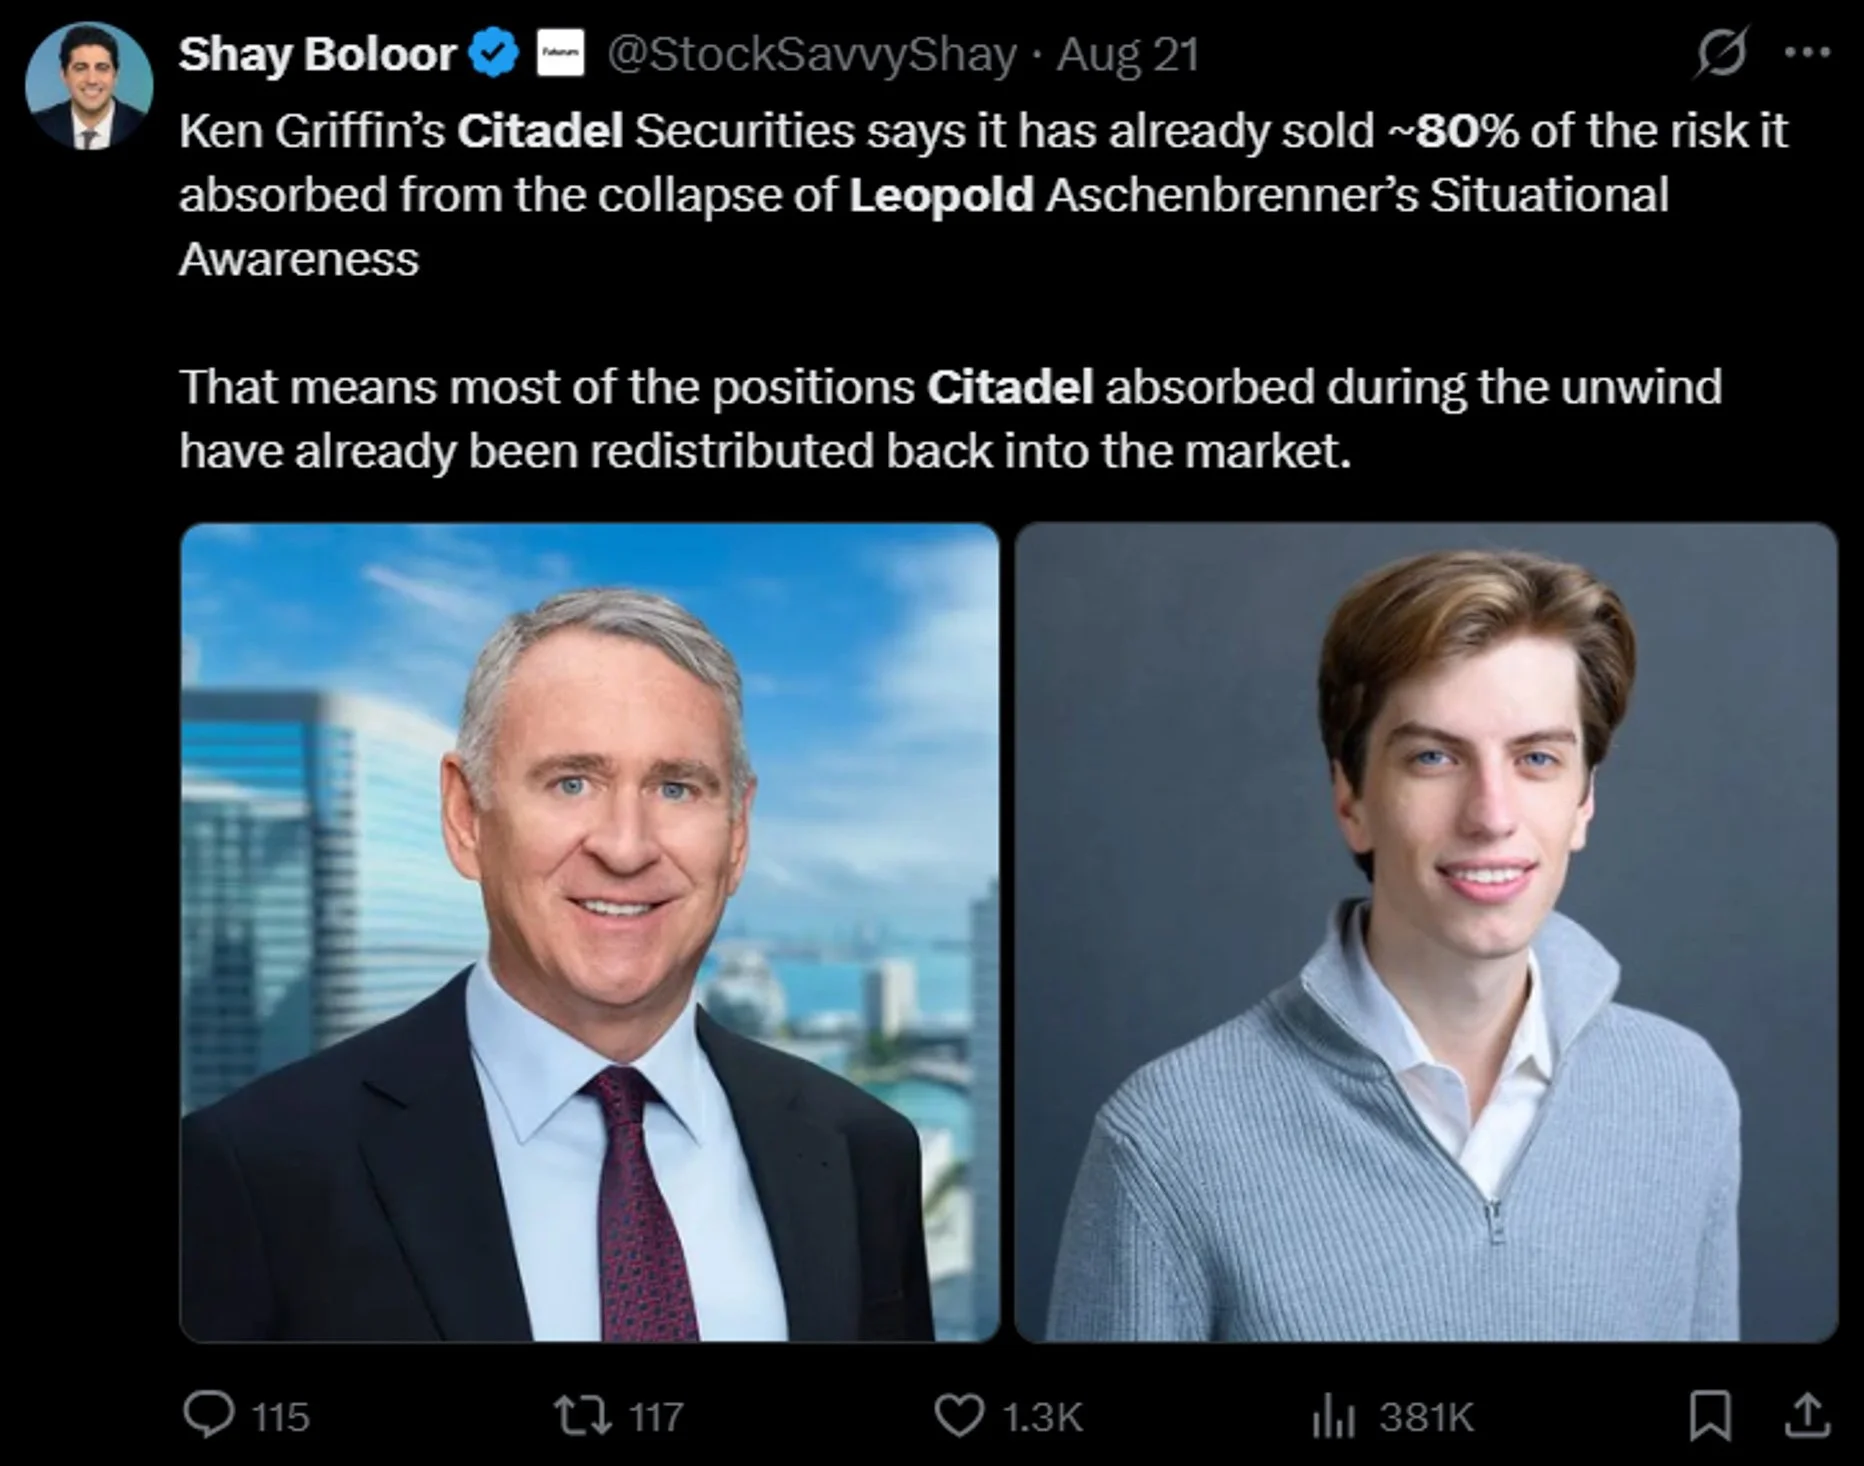
Citadel had been working out of the risk for weeks, including some enormous volume days, and was still in 20% of the Leopold portfolio. I think that’s been weighing on SOXX. We’ll see how these things trade into mid-terms and then afterwards into YE. My guess is we see meaningfully higher SOXX this year, although we might have to wait until after mid-terms to get it.
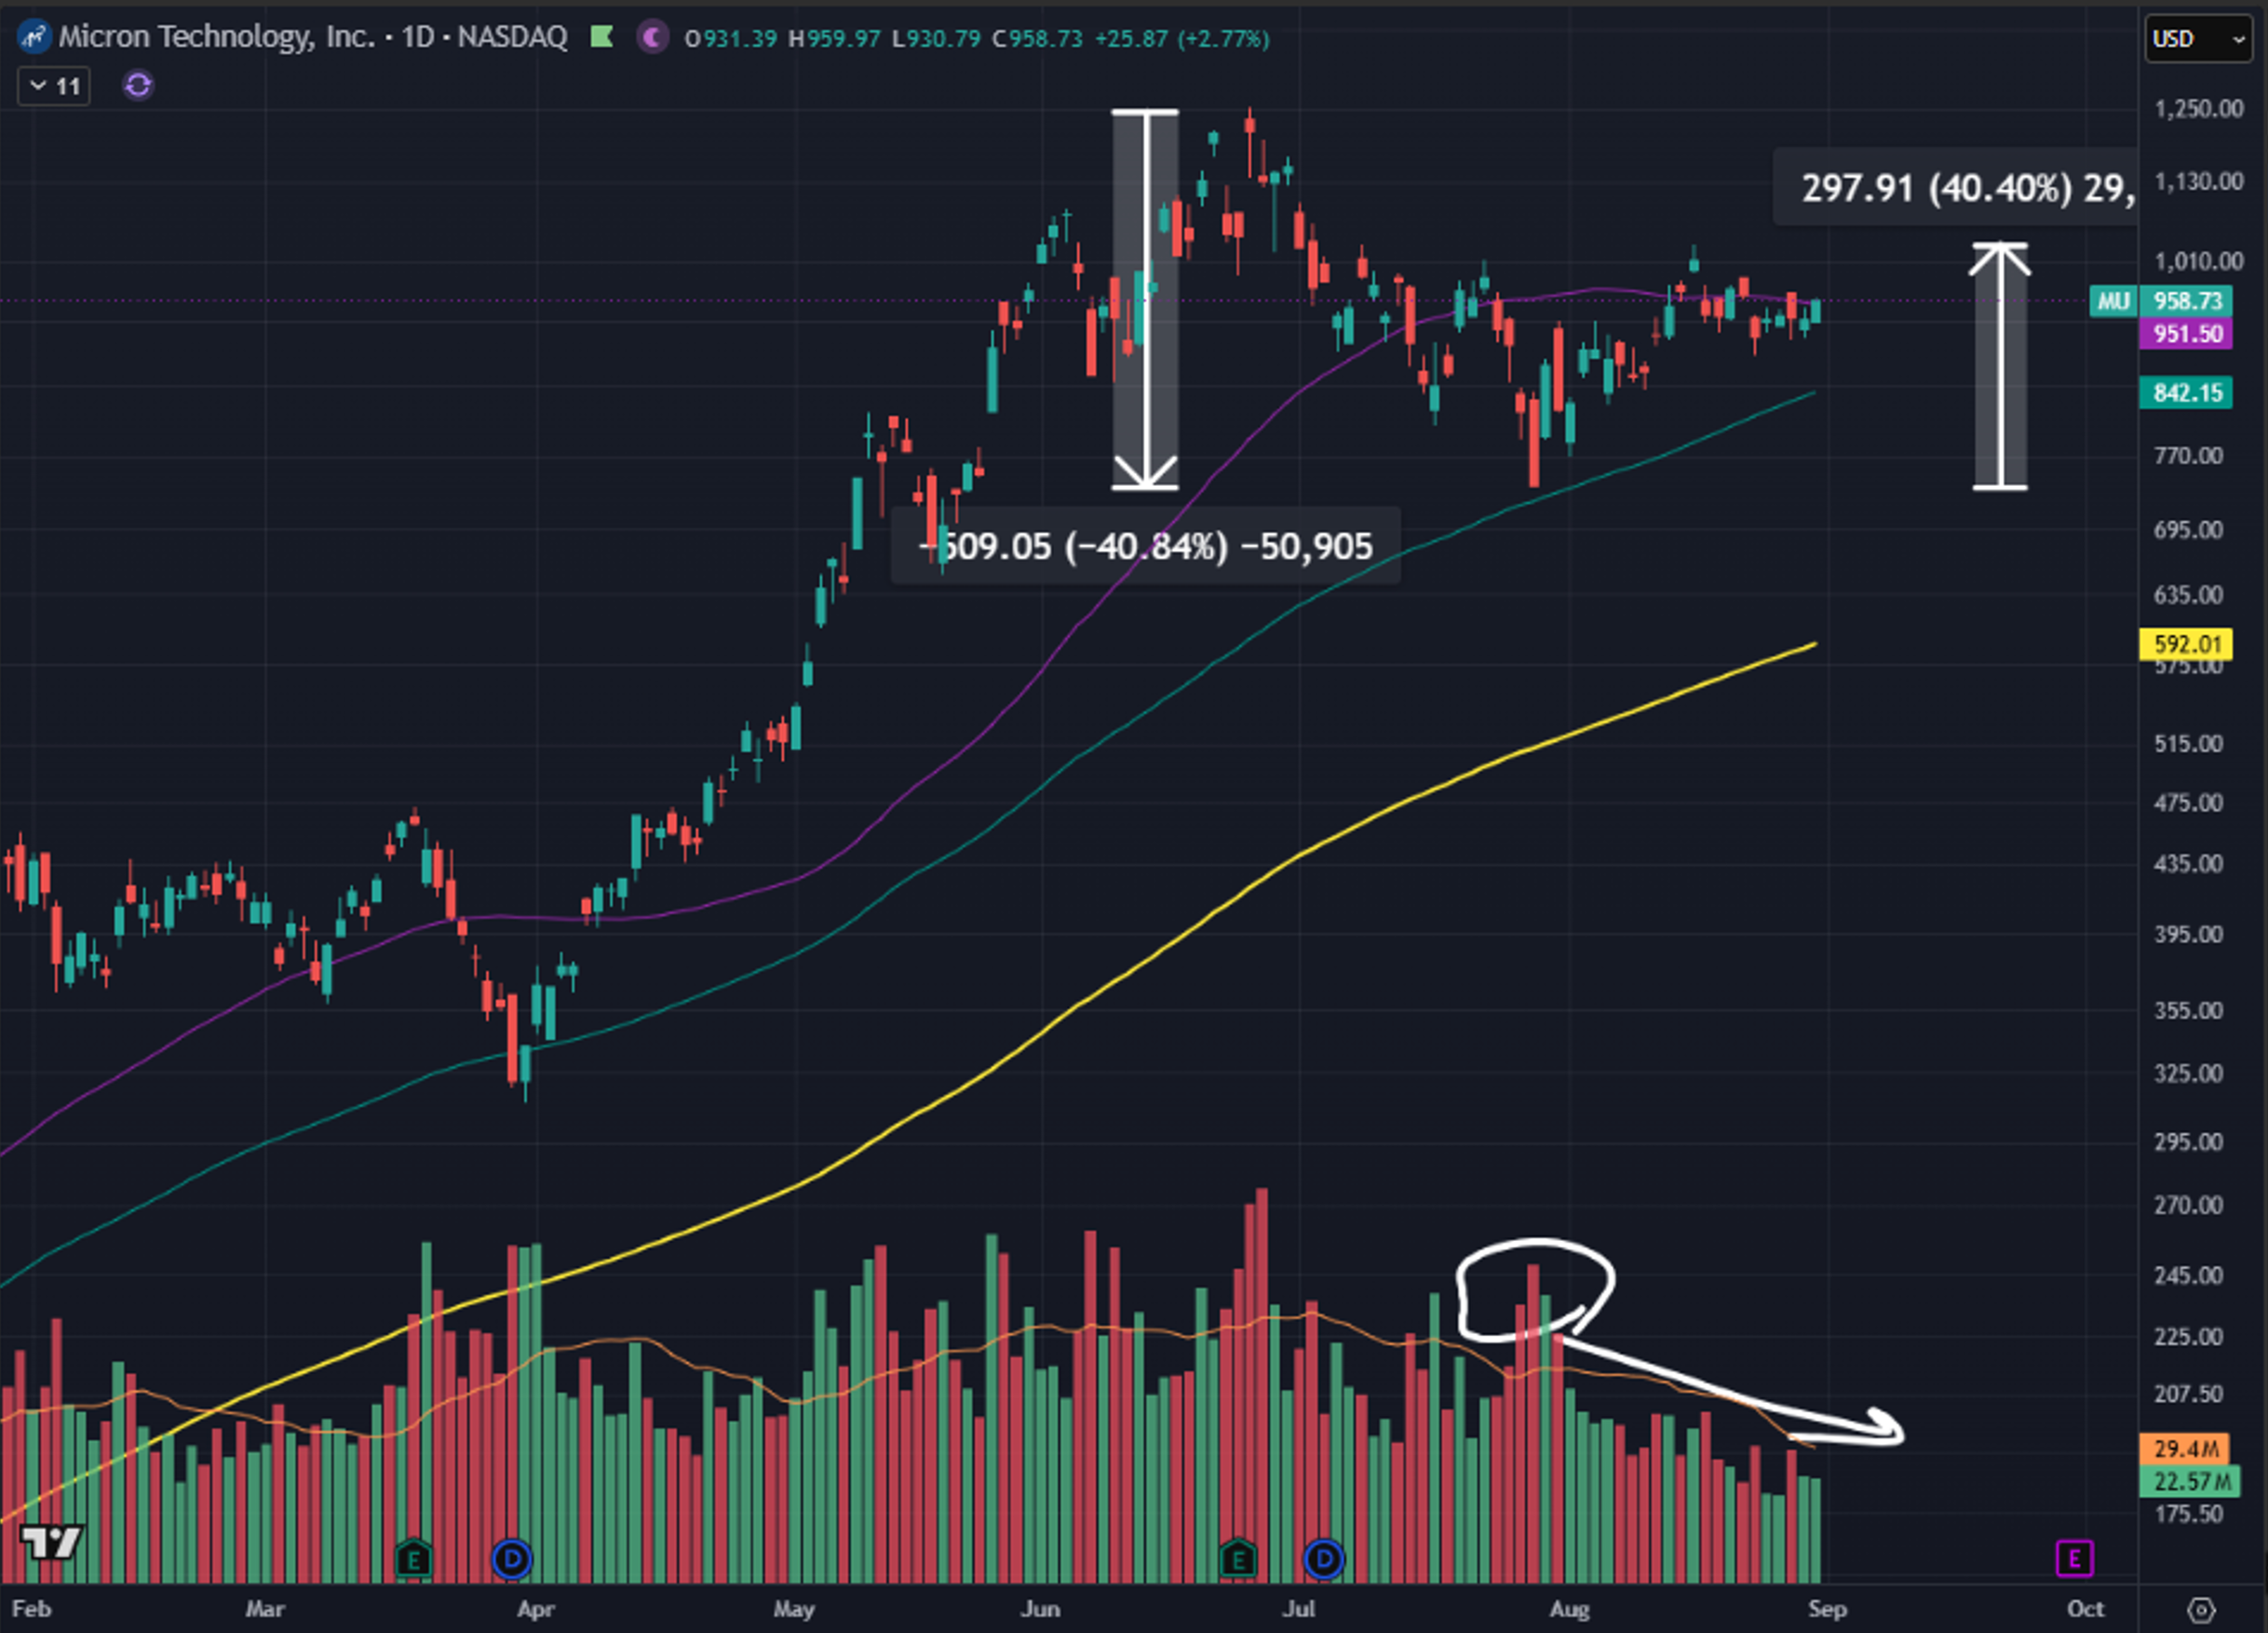
MU is a similar looking chart to SOXX but I think it looks healthier-
Source: TradingView. As of 8/31/26.
Down 40% in a straight line. Up 40% in a straight line. Now consolidating/flagging into declining volume. Probably gearing up for another leg higher. Micron and the memory trade overall is probably the most debated topic in the entire stock market. IMO, the fundamentals on memory got meaningfully better in August. Maybe I’m missing something, but MU looks like a business that is going to continue performing spectacularly through 2030. If that’s even close to true, the business will generate an amount of free cash flow by 2030 that approaches its current market cap. That seems like a great deal.
NVDA was at the center of the two most significant announcements in AIVC in August. The first was the August 10th announcement of an NVDA partnership of up to $500bn of datacenter financing, to be provided by a conglomerate of the largest asset managers in the world – Goldman, Blackrock, Blackstone, KKR, Brookfield and Apollo. Here’s the 2 min clip of all the CEOs on CNBC. Here’s the full ~40 min segment with all those CEOs around a roundtable. It’s worth the watch. If that $500bn number comes anywhere close to fruition, it will be the largest inflation-adjusted conglomerate private infrastructure financing of all time.
The other very significant announcement NVDA made this month was introducing 70% Y/Y revenue growth in 2027. Consensus was at 44%. This is the first time the market had heard this number from NVDA, and it is likely still too conservative because NVDA beats and raises consistently. There are strong positive readthroughs downstream from NVDA into AIVC if NVDA is growing 2027 revs by 70%+.
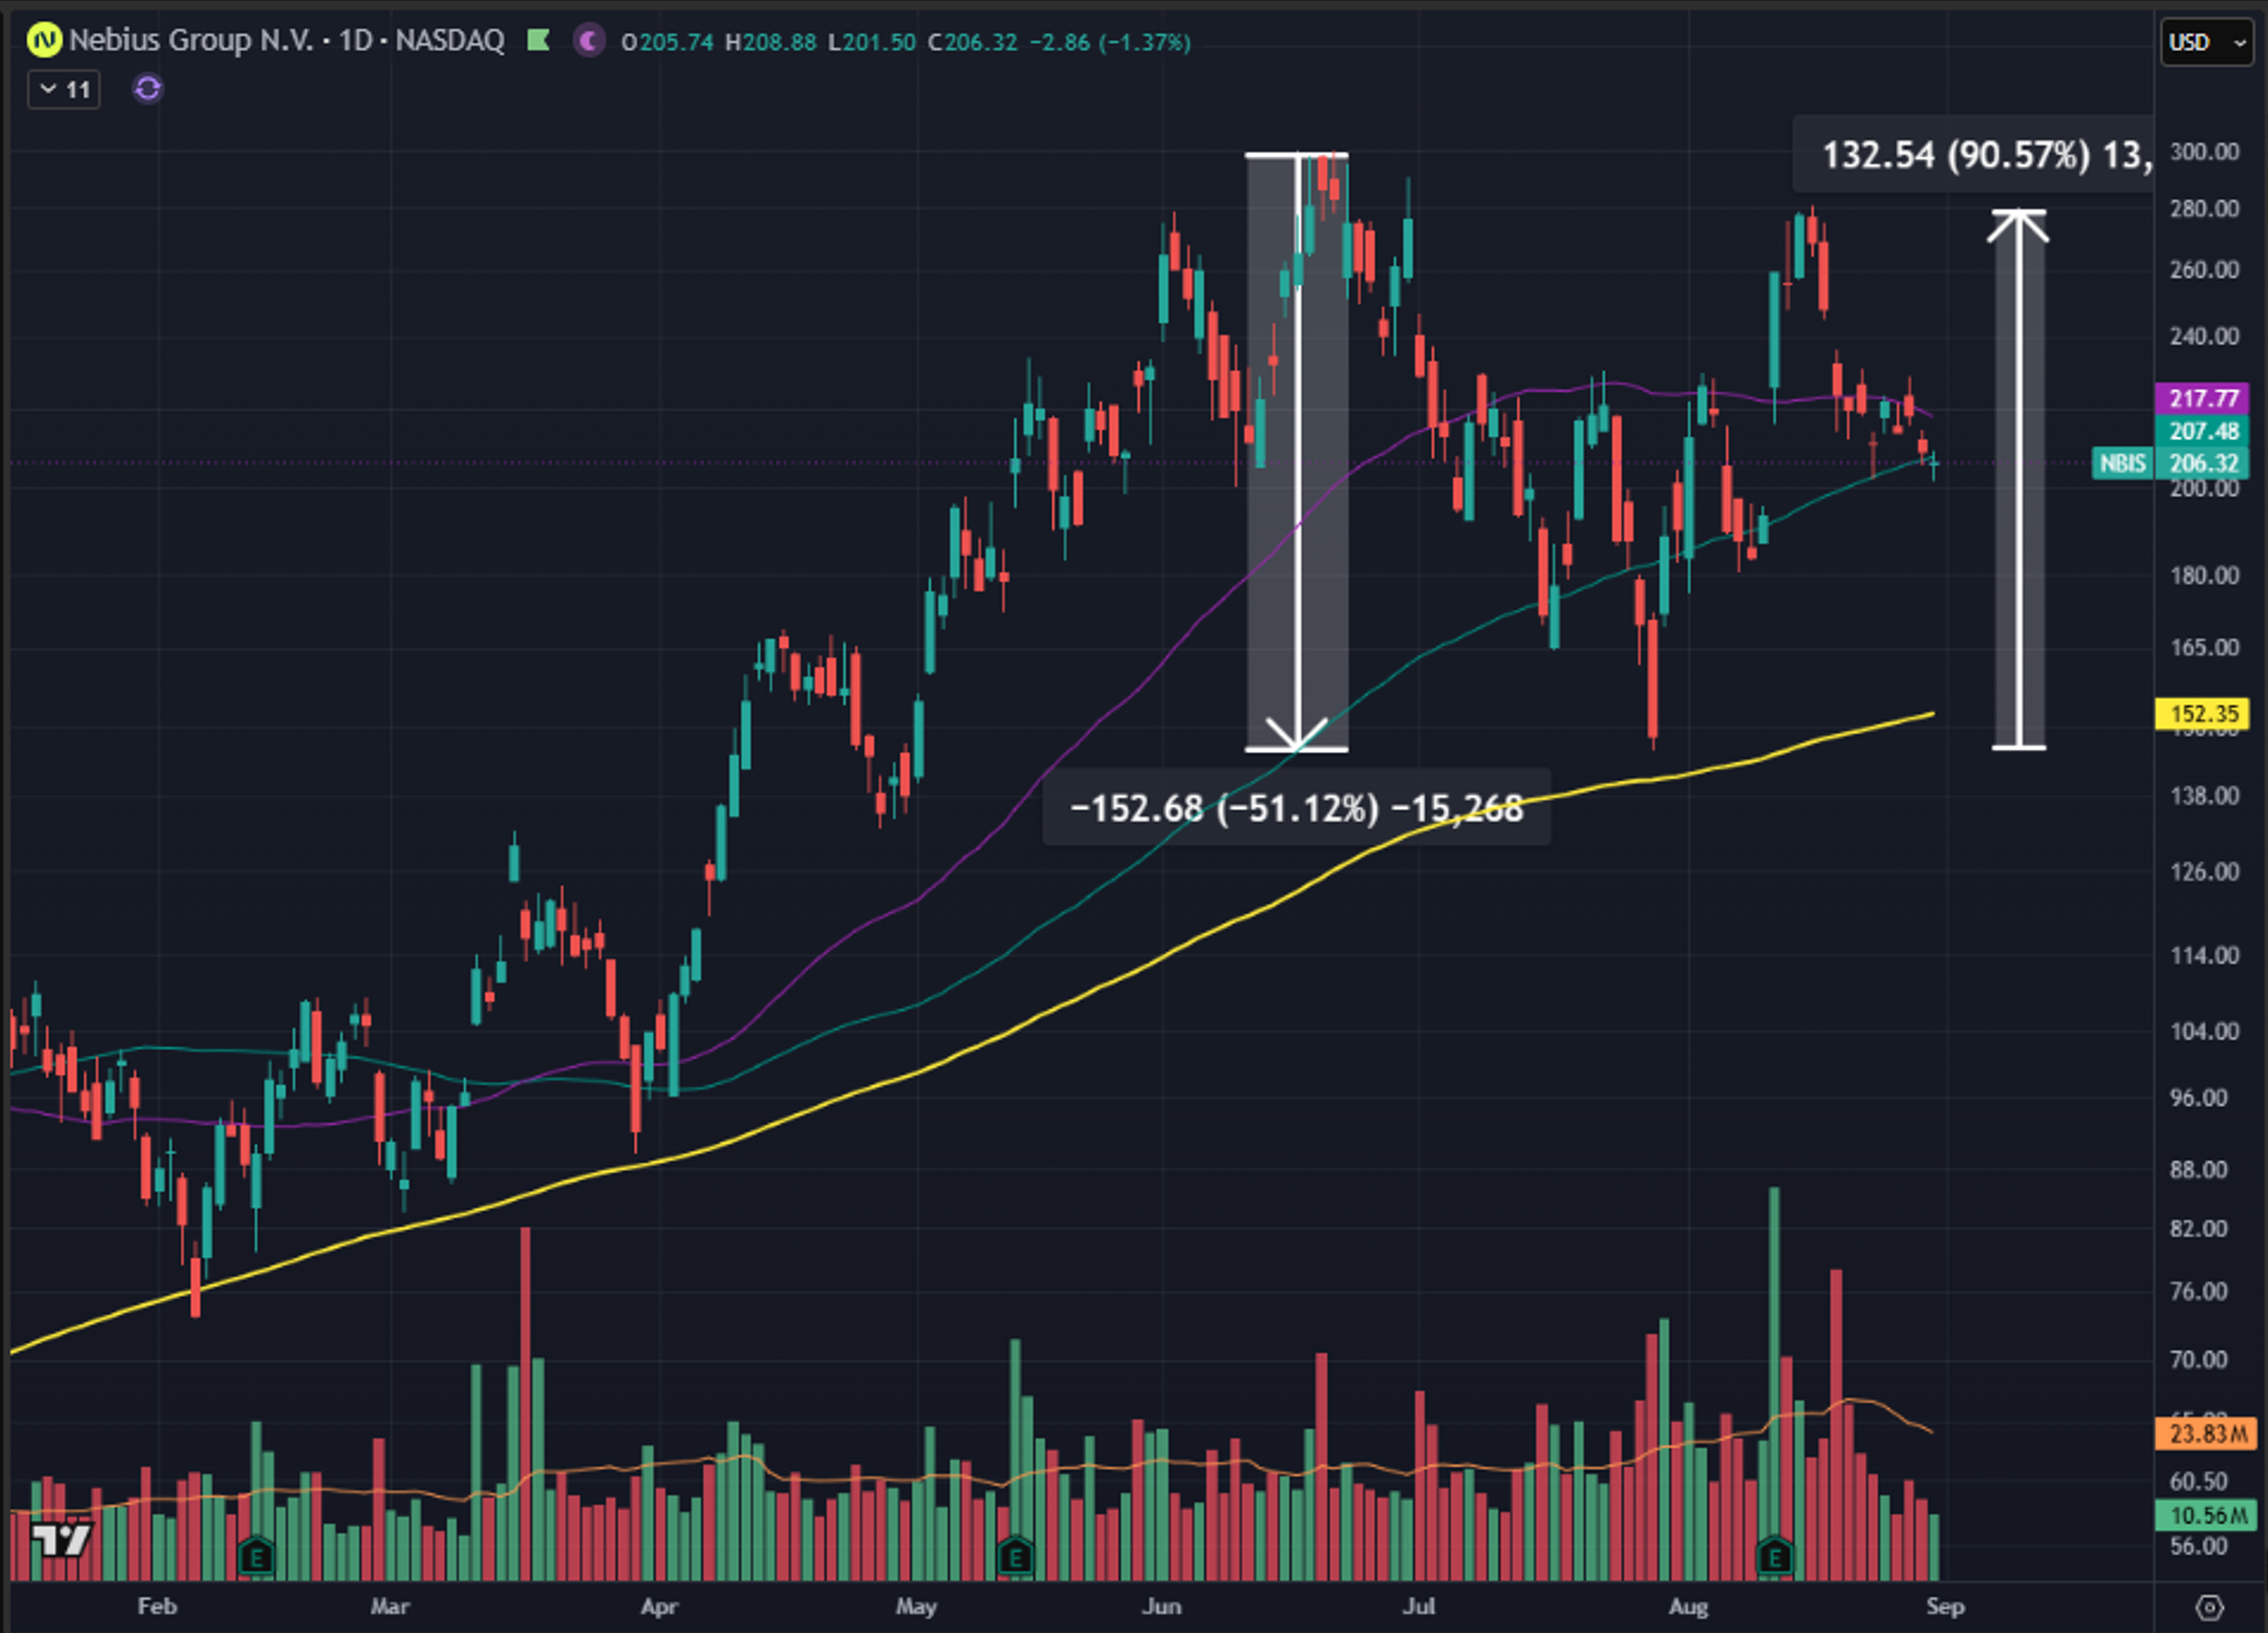
NBIS was one of Leopold’s largest holdings. It is a name that greatly benefits from both of those NVDA announcements in August. Chart looks like this-
Source: TradingView. As of 8/31/26.
Big time volatility. Down 50% in a straight line through Korea + Leopold. Massive 90% bounce in a straight line including home run quarterly results. It’s been consolidating the last couple weeks. NBIS is viewed as the best-in-class datacenter name. A neocloud that could actually transition into a hyperscaler. There are some fears about data center permitting issues in some states. I think that’s a risk worth looking through in the case of NBIS. The fundamentals got better for NBIS in August.
Closing Remarks
September is historically the worst month of the year for the stock market, with the SPX averaging a ~1% loss going back to 1928. We have an additional piece of seasonality with mid-terms in November.
The mid-term September seasonality is not great, but it’s more of a mixed bag.
On one hand, the worst three (and four of the worst five) September performances ever came in mid-term years-
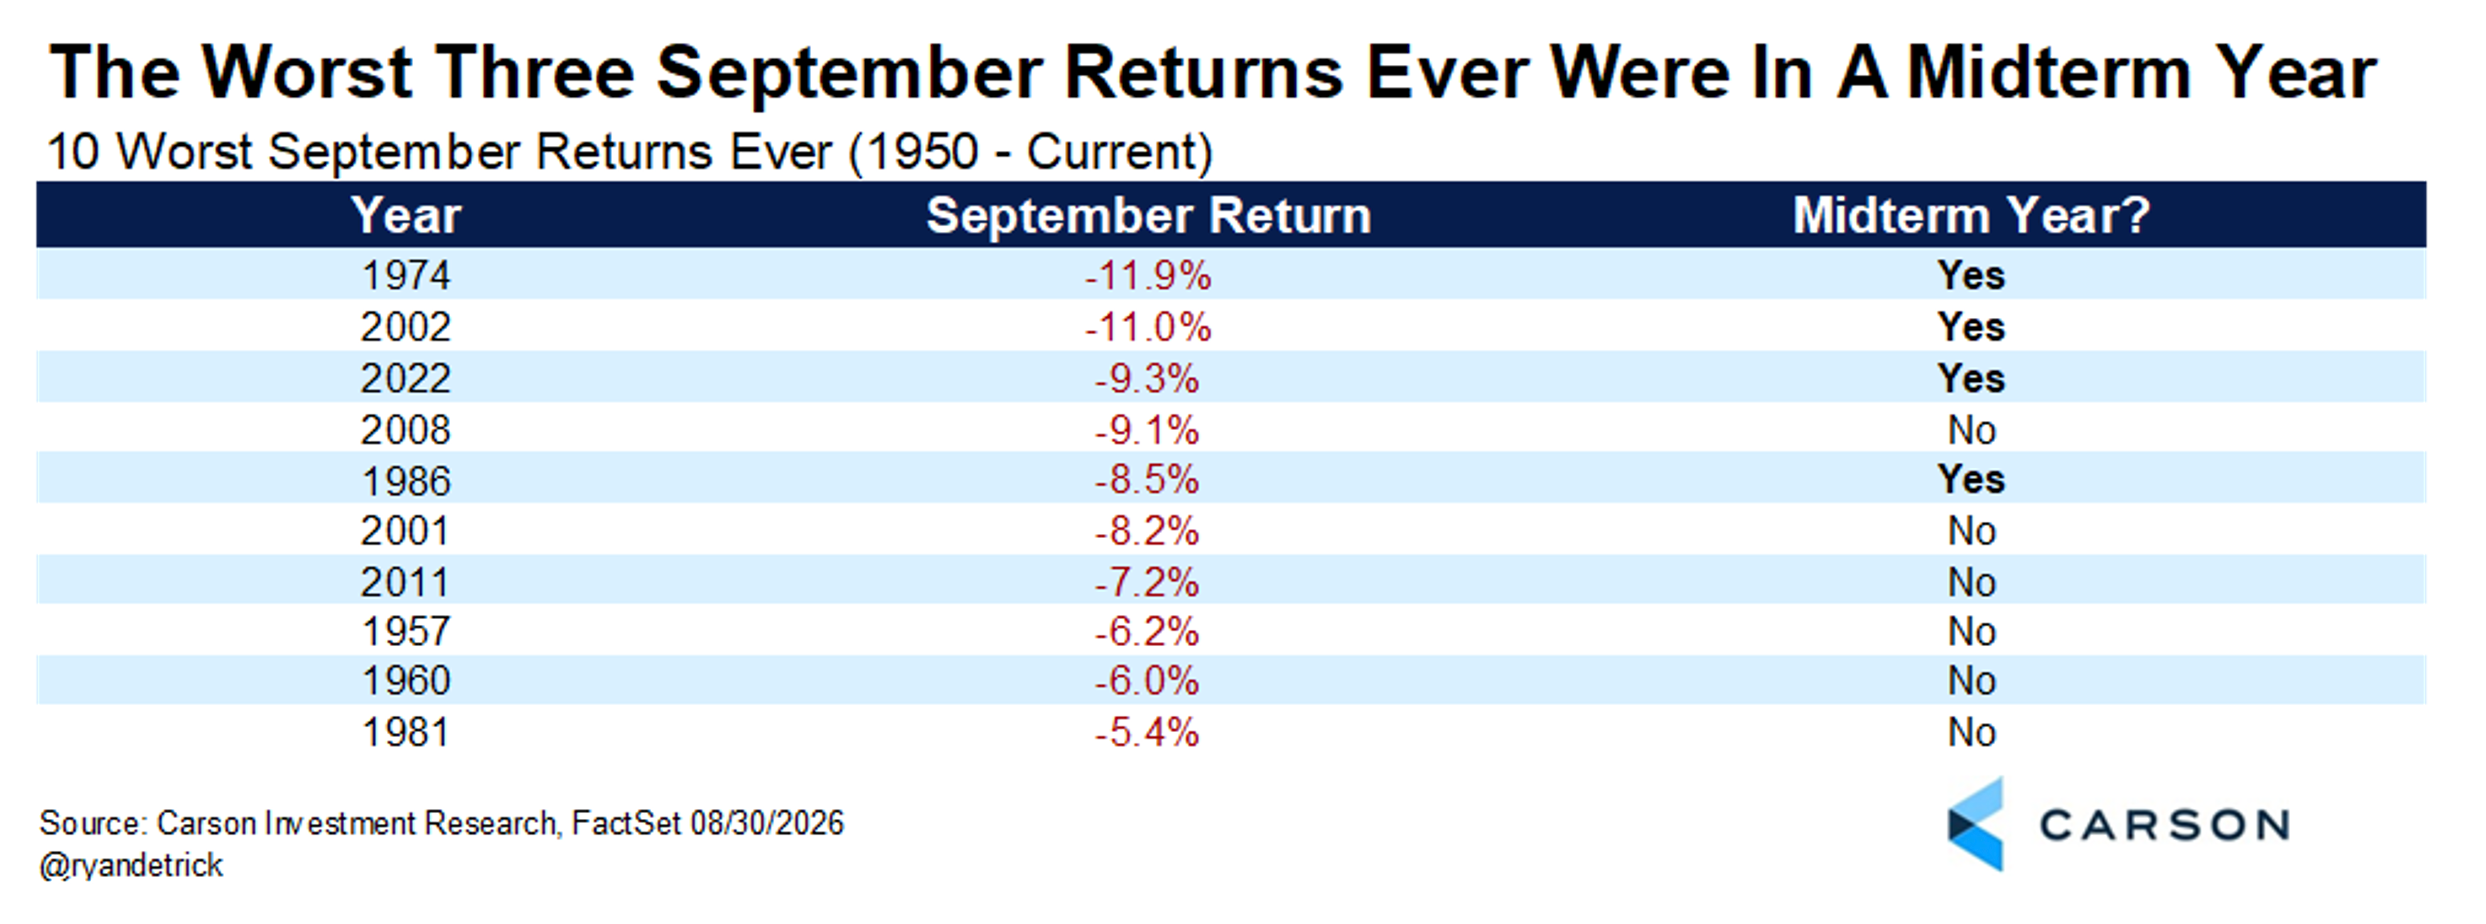
But it’s worth mentioning that 1974, 2002 and 2022 all had weak years going into those Septembers. That’s not what we have in 2026.
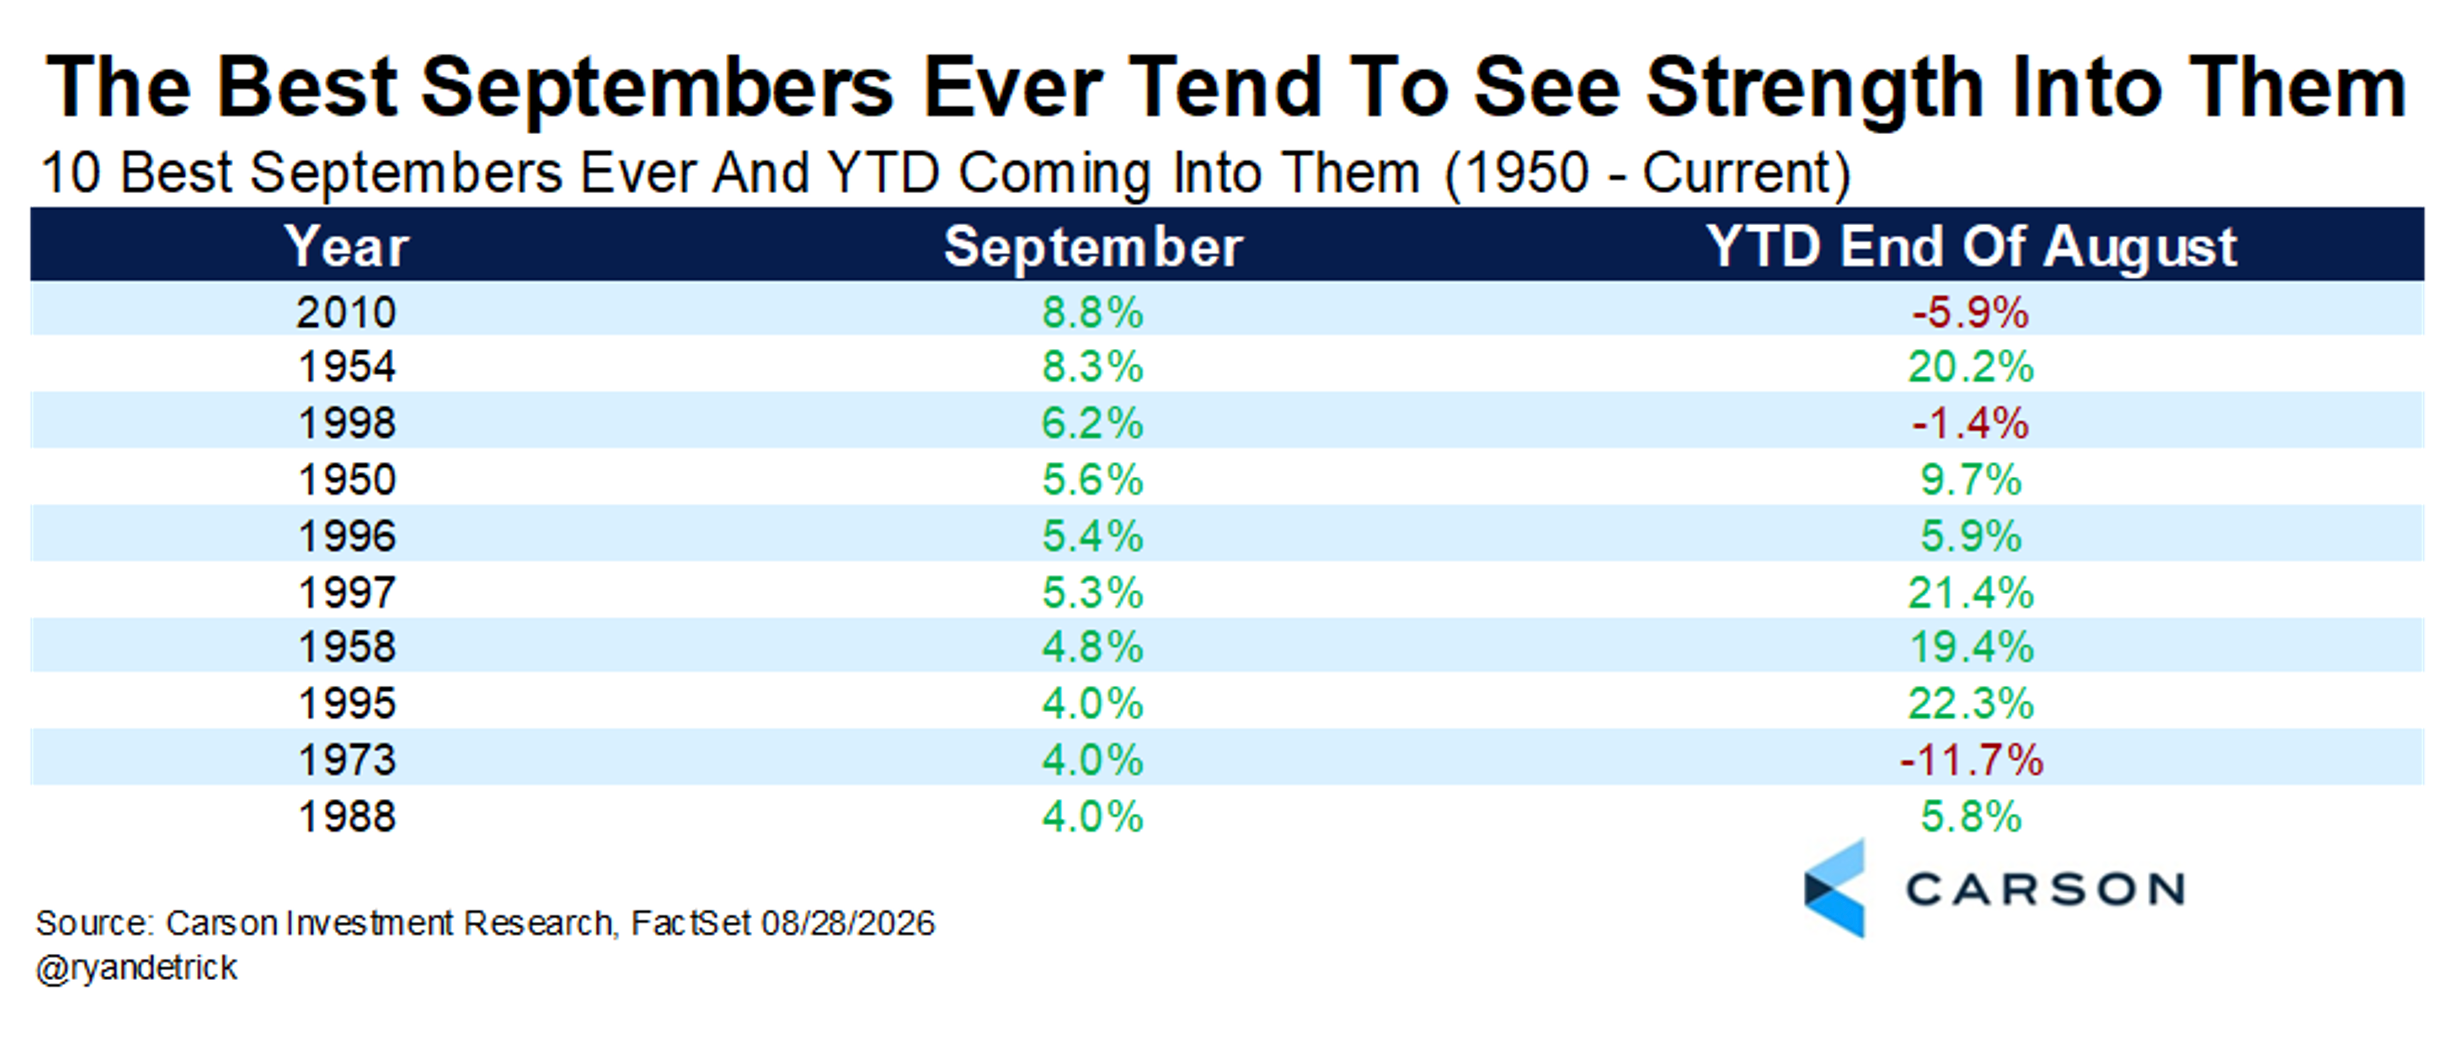
On the flipside, the 10 best Septembers ever mostly had good YTD performance going into the month, which is what we have in 2026-
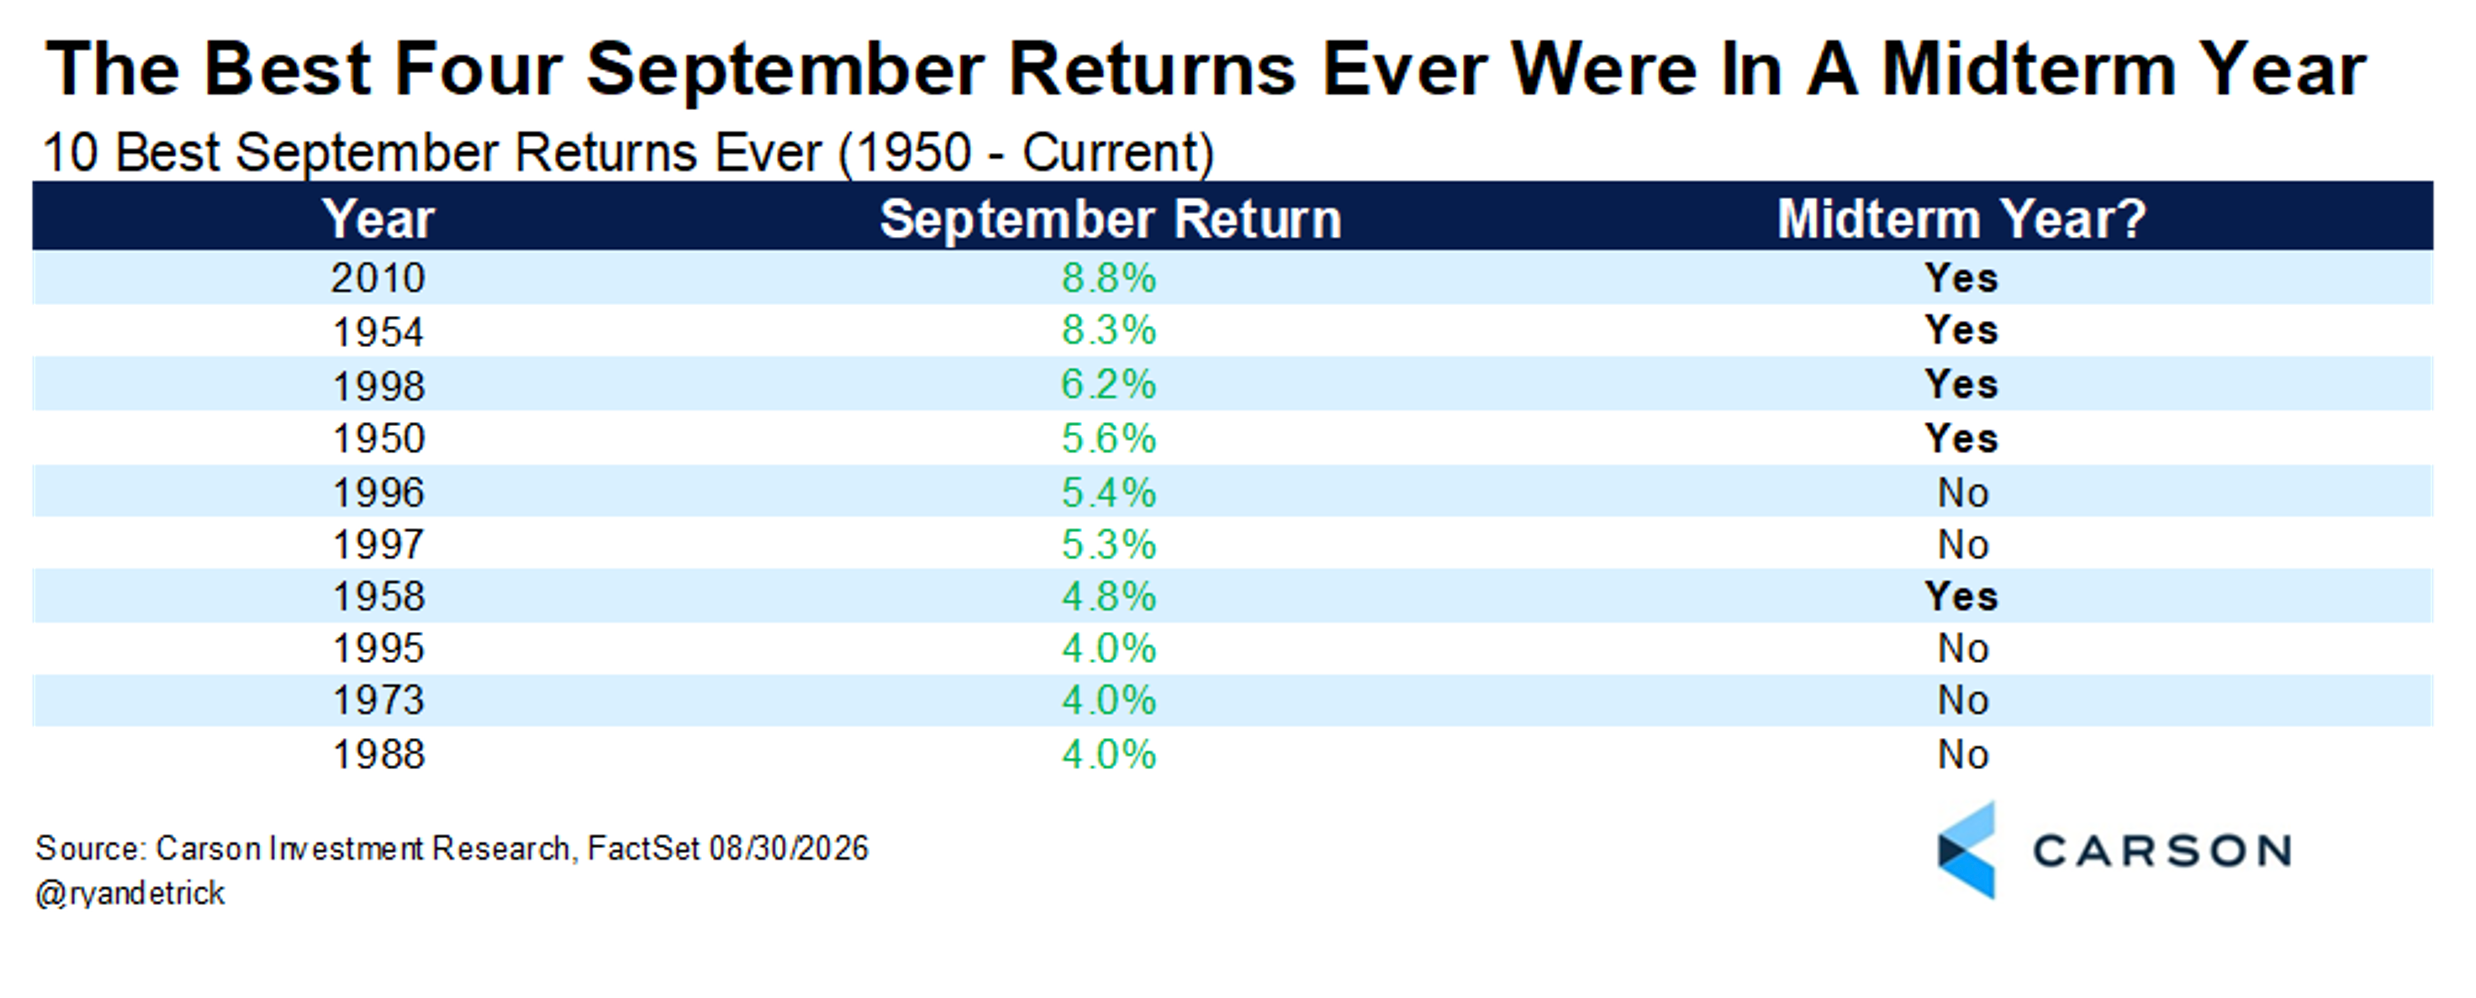
When looking at the best Septembers ever, it’s noteworthy that the top 4 are all mid-term years-
All of that I think adds up to warranting at least a bit of near-term cautiousness. Probably not the ideal time to be YOLO leverage-longing AIVC stocks (or crypto for that matter). But any additional weakness in AIVC broadly I think is a good longer-term buying opportunity. I wish I could say the same about crypto, but I don’t see it. At least not yet.
“If you don't enter the tiger's cave, you can't catch its cub.”
-Japanese Proverb
Travis Kling
Founder & Chief Investment Officer
Ikigai Asset Management
1. Ikigai Asset Management is the trade name for a collection of advisory and consulting businesses operated by Travis Kling, Anthony Emtman, and their team.
The information contained or attached herein is not intended to provide, and should not be relied upon for, accounting, legal or tax advice or investment recommendations. This presentation may contain forward-looking statements that are within the meaning of Section 27A of the Securities Act of 1933 and Section 21E of the Securities Exchange Act of 1934. These forward-looking statements are based on management’s beliefs, as well as assumptions made by, and information currently available to, management. Although management believes that the expectations reflected in these forward-looking statements are reasonable, it can give no assurance that these expectations will prove to be correct. This email is for informational purposes only and does not constitute an offer to sell, or the solicitation of an offer to buy, any security, product, service of Ikigai as well as any Ikigai fund, whether an existing or contemplated fund, for which an offer can be made only by such fund’s Confidential Private Placement Memorandum and in compliance with applicable law. Past performance is not indicative nor a guarantee of future returns. Please consult your own independent advisors. All information is intended only for the named recipient(s) above and is covered by the Electronic Communications Privacy Act 18 U.S.C. Section 2510-2521. This email is confidential and may contain information that is privileged or exempt from disclosure under applicable law. If you have received this message in error please immediately notify the sender by return email and delete this email message from your computer. Copyright 2023 Ikigai Asset Management, LLC. All Rights Reserved.
NOT INVESTMENT ADVICE; FOR INFORMATION ONLY
PAST PERFORMANCE IS NOT A GUARANTEE OF FUTURE RESULTS
