July 2020 - Monthly Market Update
/Monthly Update || July 2020
“The biggest investing errors come not from factors that are informational or analytical, but from those that are psychological.”
Opening Remarks
Greetings from inside Ikigai Asset Management¹ headquarters in Marina del Rey, CA. We welcome the opportunity to bring to you our twenty-second Monthly Update and hope these are helpful in better understanding some of what we’re doing and what we’re seeing. We have the privilege of deploying capital on behalf of our investors into a new technology and asset class that we believe will fundamentally change the world and create trillions of dollars of value in the process.
We believe we are obligated to be shepherds of this technology – to help the world better understand the powerful potential of DLT and crypto assets, and to fund and be an ambassador for DLT projects that will change our lives forever.
To that end, the month of June brought significant advancements on multiple major global macro forces that collectively make up what continues to be the most dynamic macro landscape we have seen in decades. While most assets classes, including BTC, just chopped around during the month, that relatively steady price action belied significant large-scale change occurring in the world right now. We are living in a world that is in flux on multiple levels. Uncertainty abounds. The near future will likely not be like the near past, but at this moment it’s not entirely clear what exact changes that near future will bring. That feeling, the feeling of being on the brink of change but being unsure what the other side of that change looks like, is fundamentally unsettling to humans, which makes it fundamentally unsettling to markets. These are not settled people, and these are not settled markets.
What is unequivocally true and has become increasingly more true for 12+ years, is that financial markets are entirely beholden to monetary and fiscal policies from central banks and governments globally. The United States remains convincingly in the driver’s seat there. Capitalism, like you would ever read about in textbooks, has become deeply distorted. Distorted on multiple, interrelated layers. This has been ongoing for many years but has seen a significant acceleration since early March. As a reminder, that was 115 days ago, so we’re still real early on a lot of this.
Even though we’re early on a number of these monetary and fiscal policy factors, that doesn’t mean that much of what has already occurred can be walked back. Much of it can’t be walked back. The Fed’s balance sheet cannot contract any meaningful amount for years. We may never stop QE again. The Fed may be in the public debt markets forever. Increased unemployment benefits may be in-place for quarters to come and they may become a permanent feature. PPP & EIDL-type programs are set to extend and versions of them may become a permanent feature.
Another related major factor that is also clear to me is that fiscal stimulus cannot be pulled back in the face of this magnitude of social unrest. You cannot have the NASDAQ hit ATHs two months after initial jobless claims hit ATHs and then pull money away from everyday Americans. You cannot save EVERYONE on Wall Street and completely torch small businesses and the half of Americans making under $50k a year. You cannot take away half the country’s ability to make a living wage and then expect them to somehow not run out of money. That leads to social unrest. And if you continue to ignore structural racism inside the institutions of the United States, that unrest will be exacerbated. As well it should.
Invest
Ikigai is currently fielding interest from new investors globally. We are open to international and qualified accredited U.S. investors. Contact us to see if you qualify.
June Highlights
PayPal, Venmo to Roll Out Crypto Buying and Selling
NYDFS Proposes New Rules Making BitLicenses Easier to Apply For
SEC Commissioner Hester Pierce Is Nominated for Second Term
Bloomberg Senior Commodity Strategist Calls for $20,000 in 2020
Former CFTC Chair Testifies to Congress on Digital Dollar
Three Arrows Capital Files 13G – Owns >6% of GBTC
Bitcoin Bank River Financial Raises $5.7mm
| Symbol | June | Q2-20 | Q1-20 | YTD | Q4-19 | Q3-19 | Q2-19 | Q1-19 | 2019 | % ATH |
|---|---|---|---|---|---|---|---|---|---|---|
| BTC | -3% | 42% | -11% | 27% | -13% | -23% | 164% | 10% | 92% | -54% |
| ETH | -2% | 69% | 3% | 75% | -28% | -38% | 105% | 6% | -3% | -84% |
| XRP | -13% | 1% | -10% | -9% | -25% | -35% | 28% | -12% | -45% | -95% |
| BCH* | -12% | -1% | 26% | 24% | -3% | -47% | 154% | -1% | 30% | -91% |
| EOS | -12% | 6% | -14% | -9% | -13% | -49% | 38% | 63% | 0% | -90% |
| BNB | -10% | 22% | -8% | 12% | -13% | -51% | 86% | 182% | 123% | -37% |
| XTZ | -16% | 46% | 20% | 75% | 49% | -3% | -12% | 129% | 192% | -39% |
| XLM | -5% | 64% | -10% | 48% | -26% | -41% | -3% | -5% | -60% | -93% |
| LTC | -9% | 6% | -5% | 0% | -26% | -54% | 101% | 99% | 36% | -89% |
| TRX | 3% | 41% | -13% | 23% | -8% | -55% | 36% | 25% | -29% | -94% |
| Aggregate Mkt Cap | -2% | 44% | -5% | 36% | -14% | -29% | 117% | 14% | 51% | -69% |
| Aggr Alts Mkt Cap | 0% | 45% | 4% | 51% | -16% | -40% | 68% | 18% | -1% | -83% |
Source: CoinMarketCap. As of 6/30/20. BCH includes SV.
“It’s All One Trade”
In our May 1ˢᵗ Monthly Update, we posted the below chart of SPX, WTI, Gold, BTC and inverted VIX (now updated) and posed the questions – “What’s this chart telling us? That it’s all one trade? If it’s all one trade – what is the trade?”

Source: TradingView. As of 6/30/20.
We’ll try and unpack that for you here. As previously discussed, there are big macro factors significantly advancing right now. The broad direction of some are easier to determine than others. The pace of advancement of some is easier to determine than others. Some are still opaque but appear primed for significant change. They’re all worth touching on.
Inflation/Deflation
We’re talking 2021 in US CPI terms. Whether that number is 1.5%/2.5%/3.5%/4.5% matters a lot for BTC. There are smart guys saying inflation will be 4-5% in 2021. There are smart guys saying we currently face massive deflationary forces. You can broadly imagine what the state of the world might be in those various inflation scenarios. What the levels of monetary and fiscal stimulus might be. What the shape of the economic recovery might be. What US/China relations might be. As new information becomes available, you dial in your expectations for near-term inflation accordingly. 2022 and 2023 are worth thinking about as well. Longer-term inflation factors become pretty difficult to estimate, as so much is unknown at this time.
I doubt the Fed/Treasury will permit this number to go much lower for any meaningful amount of time before they start shooting against it to get it higher by any means necessary. But that may be easier said than done.

I doubt the Fed/Treasury will permit this number to go much higher for any meaningful amount of time before they start shooting against it to get it lower by any means necessary. But that may be easier said than done.

Source: TradingView. As of 6/30/20.
A forty-year downtrend that is coming close to its natural conclusion - zero. Unless zero isn’t the bottom.

Source: TradingView. As of 6/30/20.
US/China Relations
If Biden or anyone other than Trump wins in November, its very difficult right now to forecast how tough he or she will be on China. But its safe to say they’ll likely be less tough than Trump. If Trump wins a second term it is my base case that his administration will put the screws to the Chinese Communist Party (CCP) to a degree we have not seen and a lightyear away from Obama’s stance toward China broadly. The US has maybe 10 or 12 economic arrows in its quiver and can decide how many of those it wants to shoot and in what order. We’re seeing some of that already. In a second Trump administration we’ll see more, which will start with a full accounting for Covid-19.
While I don’t believe kinetic war is on the near-term horizon, history would tell you an avoidance of kinetic war in situations like these is statistically unlikely. Economic, information and cyber warfare have been waged for quite some time already and those are set to intensify. If the US shoots 10 economic arrows over the next 24 months, we may watch the “inevitability” of China as a global superpower destined to usurp the US disintegrate in the back part of the 2020’s. It’s much too early to know for sure what will happen, but it bears close watching. Hong Kong’s independence may be a leading indicator.
Fed Balance Sheet Expansion
QE has slowed meaningfully, albeit from truly stunning levels.

Source: Federal Reserve. As of 6/30/20.
More exotic forms of QE continue to be implemented, like the US government now being a Top 5 holder of many corporate credit ETFs through the Secondary Market Corporate Credit Facility (SMCCF). The US government is the third largest holder of of LQD. LQD holds 2,000+ corporate bonds. LQD’s second largest holding is Anheuser-Busch. Lol.

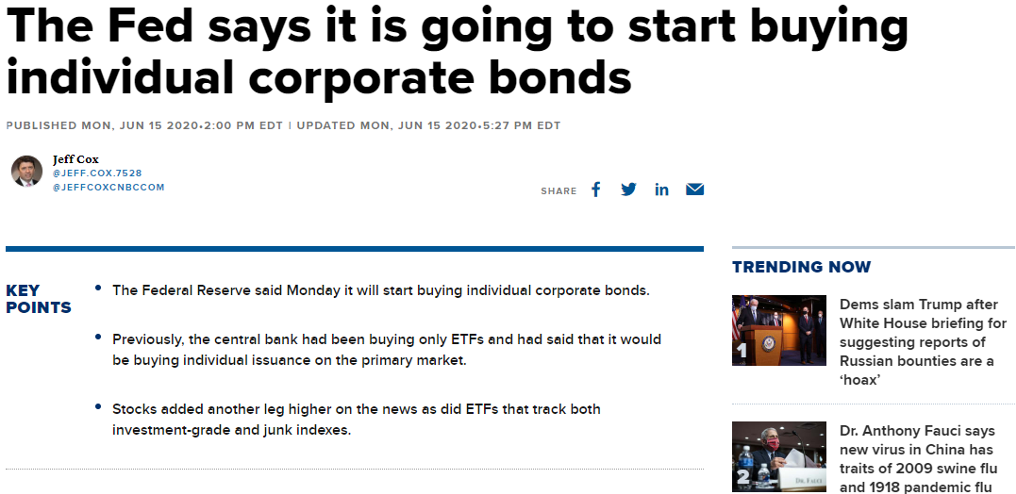
Source: CNBC. As of 6/15/20.
Fiscal Stimulus
The economy has a gaping hole in it right now.

The US government has plugged that gaping hole left in the economy by corona. In fact, they plugged the hole with more cash than the size of the hole.

The $1200 checks have been spent. Additional federal unemployment is set to expire at the end of July. The economy is nowhere near ready to have that support removed, so it’s a good base case assumption we will see those measures extended, at least through the election. Washington is talking about a $1.5 trillion infrastructure deal. We’re likely gonna need it. The Dollar Shortage allows the US government to effectively make the rest of the world pay for this fiscal support that fortifies the US economy and its people. The USD in 2020 is not your parents’ world reserve currency and it’s definitely not your grandparent’s.
Gold
This looks like a chart that wants new ATHs.
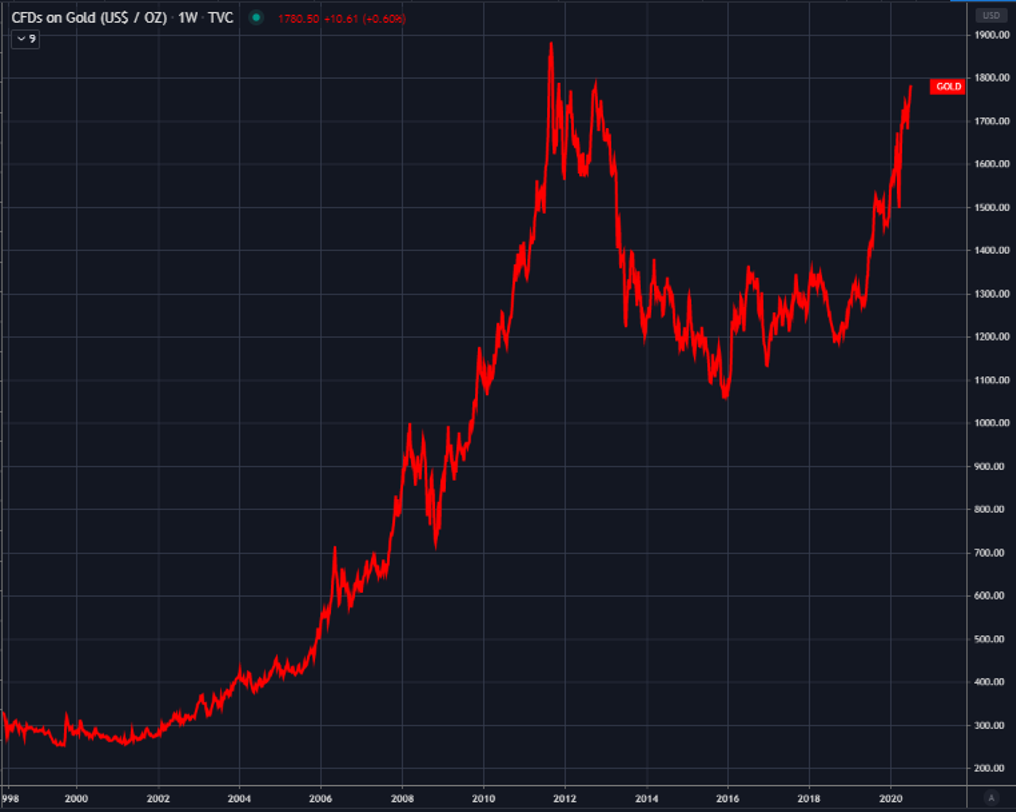
Source: TradingView. As of 6/30/20.
AUM in gold ETFs is already at ATHs.
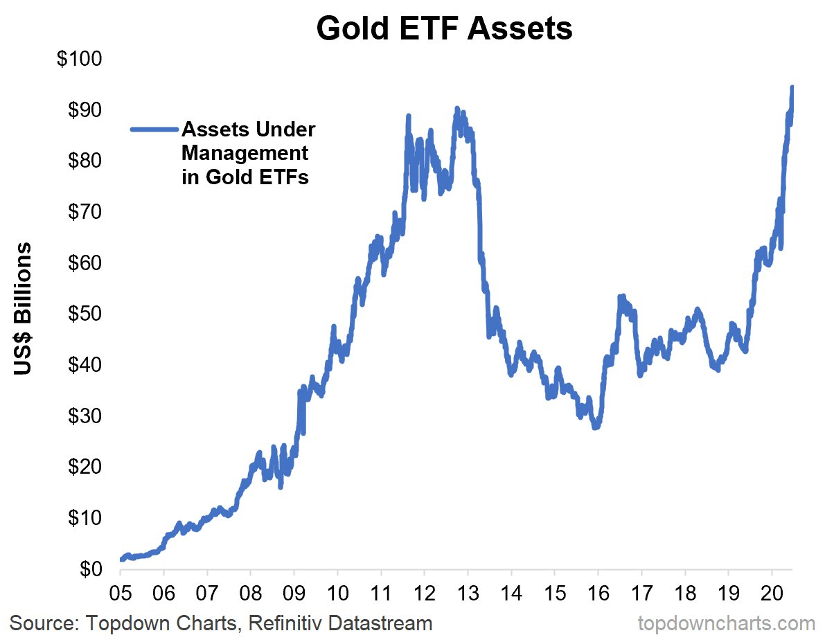
SPX/Gold ratio peaked September 2018 and has made a series of lower highs and lower lows since then. An ounce of gold today will buy you the same amount of S&P 500 as it did in 1996.

Source: TradingView. As of 6/30/20.
Stock Market Weirdness
Lots of strange stuff going on in equities right now. The WallStreetBets, RobinHood, Davey Day Trade Global situation is one.
Source: RobinHood. As of 6/15/20
Growth vs Value is another.

Source: SentimentTrader. As of 6/26/20.
The market’s exuberance towards tech stocks is unheralded.

Pace of Economic Recovery
This broad factor is one of the most unclear currently. There is a high degree of uncertainty about what the next four quarters’ Q/Q GDP growth rate will be. We know 2020 is going to be bad. That is priced in.

What is not known is what a second wave of corona might do to re-opening the economy. We do not know if it will get worse again when the weather turns colder this year. We don’t know how herd immunity will work. We don’t know what long-term damage has been done to the economy and how difficult it will be to get the gears turning back again. We don’t know what the Work From Home trend will do to economic activity broadly. Lots of unknowns.
Coronavirus
The good news – death counts have significantly decoupled from case counts. Younger people are making up an increasingly larger percentage of the new cases, and those young people are by and large beating the virus.

Source: CDC. As of 6/25/20.
The response to coronavirus has become deeply politicized, starting at the top, trickling down to state and local officials and eventually to everyday people.

What is abundantly clear, is that coronavirus hit the most vulnerable Americans the hardest. For many of the wealthiest in America, it was nothing more than a buying opportunity in equities.

The 2020 Presidential Election
Trump’s approval rating increased, and his disapproval rating decreased, from late October until late March. As the nationwide quarantine was extended into April and then May, that trend reversed. The nation began to more clearly acknowledge Trump’s shortcomings as a leader and the ineptitude of those leaders around him. When the Black Lives Matter movement exploded in late May in response to the murder of George Floyd, the very worst parts of Donald Trump were on display for all Americans.

Source: Real Clear Politics. As of 6/30/20.
For at least a year, I have been of the view that a second term for Trump was highly likely. I thought Bernie had a better chance than Biden. Biden is showing strong indications of significant cognitive decline, which is normal for a person his age. That being said, at this moment Trump’s chances of re-election are the most at risk since he took office. My confidence that he will win a second term is the lowest its been in over a year. However, there’s still a lot of time between now and November and a lot can happen.
Facebook Ad Boycott
In the last two weeks, Microsoft, Verizon, Coca-Cola, Ford, Clorox, Unilever, Levi Strauss, Denny’s and more than 200 other companies have suspended advertising on Facebook and/or Instagram in response to how Facebook has been handling hate speech on its platforms, under the banner of #StopHateForProfit. Corporations are desperately trying to avoid the public’s ire against institutions they view as failing the people. Zuckerburg has recently said that while some changes to stop hate speech on the platform have already occurred, more are coming. Issues around free speech, data privacy and algorithmic echo chambers continue to plague social media platforms and it does not appear to be diminishing.
Social Unrest
Lastly and most importantly, society is recoiling from abuses of power and failures of institutions to a degree not seen in decades. Nowhere is this more acutely apparent than in the Black Lives Matter movement in the United States. “Defund the police” has become more than just a rallying cry. Minneapolis actually did it. Baltimore, Portland, Philadelphia, Hartford and Seattle have all already implemented budget cuts. Many other major metropolitan areas are facing intense pressure to do the same. While it remains to be seen what specific changes to society will be enacted as a result of the Black Lives Matter protest and broader social unrest, the broad direction is clear. The institutions of America are failing their people, and the people are growing increasingly tired of it. You could write a book about this picture.

“It’s All One Trade”
Inflation/deflation. US/China relations. Fed balance sheet expansion. Fiscal stimulus. Gold. Stock market weirdness. Pace of economic recovery. Coronavirus. The 2020 Presidential election. Facebook ad boycott. Social unrest. They’re all connected. They’re all interrelated. The outcome of one is dependent on the occurrences in the others.
If you heard me on Pomp’s podcast in late May, you know I’ve been talking about coronavirus as “The Great Accelerator” – meaningfully advancing trends in major global macro factors that were already in place before anyone ever said coronavirus. Corona was a massive catalyst.
CPI inflation had already been tough to come by in the United States for a decade. Coronavirus, and the US government’s response to it, crushed the economy and sent unemployment skyrocketing. This was a deeply deflationary event. To combat those deflationary forces and prevent widespread financial ruin, the US government responded with massive fiscal support. The financial markets were already primed for a spike in volatility before corona, primarily because of the ongoing Dollar Shortage. When coronavirus hit and financial markets began collapsing, the descent was so violent and the near-term outlook so dire, the Fed and Treasury stepped in with historic levels of monetary support. The combined magnitude and swiftness of monetary and fiscal stimulus was enough to bounce risk assets harder and faster than could have ever been imagined and lead to some really wonky price action. The enormity of that monetary and fiscal policy response has investors worried about the potential for some sort of collapse or hyperinflation. Risk assets have become so entirely dependent on this stimulus that central banks and governments have no choice but to print and spend more and more, or else cause an imminent and violent financial market collapse.
Evidence shows that coronavirus emanated from Wuhan, China. US/China relations were already precarious before this and they are set to get meaningfully worse. As the politicization of the coronavirus response caused our nation’s leadership to fumble about from one poor decision to the next, a high degree of uncertainty remains about when our economy will start back up again, and to what degree. This is much more painful for the bottom 90% of Americans than the top 10% which is making the bottom 90% even more angry than they already were. That anger is leading to bitter fighting. That fighting is occurring on social media platforms. A large portion of Americans are on edge and exasperated in one way or another and that has them pushing back against the institutions they view as failing them and those people are demanding change. If you give those Americans enough money, that anger may be placated. It also may cause inflation. Too much inflation and the system collapses. Not enough and it collapses the other way.
It’s all one trade. And right in the middle of all of it sits little $170bn Bitcoin.
MARKET UPDATE – LIQUID CRYPTO ASSET INVESTING
| Asset Class | June | May | April | Q2-20 | March | YTD | Instrument |
|---|---|---|---|---|---|---|---|
| Bitcoin | -3% | 9% | 34% | 42% | -25% | 27% | BTC |
| NASDAQ | 6% | 7% | 15% | 30% | -7% | 16% | QQQ |
| S&P 500 | 2% | 5% | 13% | 20% | -13% | -4% | SPX |
| Total World Equities | 3% | 5% | 10% | 19% | -15% | -8% | VT |
| Emerging Market Equity | 6% | 3% | 7% | 17% | -16% | -11% | EEM |
| Gold | 3% | 3% | 7% | 13% | 0% | 17% | GLD |
| High Yield | -1% | 2% | 4% | 6% | -10% | -7% | HYG |
| Emerging Market Debt | 3% | 6% | 4% | 13% | -15% | -5% | EMB |
| Bank Debt | 0% | 2% | 3% | 4% | -7% | -6% | BKLN |
| Industrial Materials | 5% | 4% | 1% | 10% | -10% | -9% | DBB |
| USD | -1% | -1% | 0% | -2% | 1% | 1% | DXY |
| Volatility Index | 11% | -19% | -36% | -43% | 33% | 121% | VIX |
| Oil | 8% | 35% | -43% | -17% | -55% | -73% | USO |
Source: TradingView. As of 6/30/20.
The halving has come and gone. “Miner capitulation forced selling” has come and gone. BTC is the best performing asset class YTD by a wide margin. While BTC was -3% in June it was still +42% in Q2. That being said, price is where it was two months ago. Why has it been so sluggish recently? Why isn’t number higher? Why have I heard that question posed literally dozens of times in the last month?
In my opinion, the answer is PlusToken.


At their current pace of distribution, we think PlusToken has ~2 months of selling left. We would be surprised to see BTC punch through $10.5k before that supply overhang is removed. We would be surprised if BTC didn’t punch through $10.5k in the two months following that supply overhang removal. It’s just that simple.
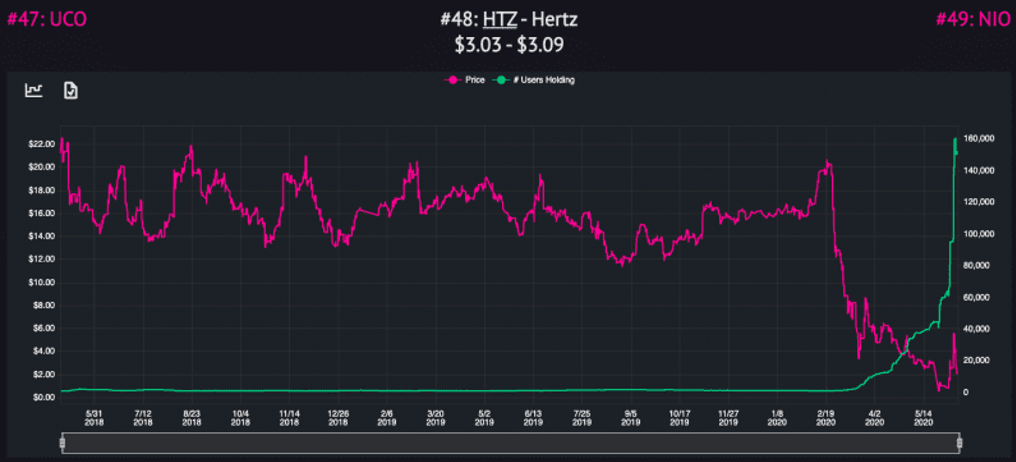
As the PlusToken overhang continues to be a roadblock to higher BTC prices, a lot of fast money that had found a home in crypto moved on to “stonks”. Who needs BitMEX, Telegram and Ian Balina when you have RobinHood, WallStreetBets and Davey Day Trade? And why keep getting run over by a Chinese ponzi when you can yield farm?
So with BTC stuck, ETH has managed to outperform BTC by 48% YTD, up 75% vs BTC 27%. What’s driving that outperformance?

Source: DefiPulse. As of 6/30/20.
DeFi is the 2020 version of IEOs, with a couple spoonful’s more legitimacy. Does the broad direction of “Open Finance” have promise? Undoubtedly. Is that promise overvalued today in the names that currently trade publicly? Possibly. Are the current use cases for DeFi primarily leverage? Yes. Are many people using DeFi? No. Can the current infrastructure in place handle multiples of current throughput? Not likely. Is there a ton of hype? Absolutely. Do we approach the situation with a high degree of caution? Yes we do.
The market cap gains are somewhat meager, but in % terms they certainly bear watching.
| Market Cap | % Change | Market Cap Growth | |||||||
|---|---|---|---|---|---|---|---|---|---|
| 12//31/2019 | 3/31/2020 | 6/30/2020 | Q1-20 | Q2-20 | YTD | Q1-20 | Q2-20 | YTD | |
| LEND | $19 | $26 | $171 | 38% | 563% | 1198% | $7 | $145 | $223 |
| KNC | 32 | 77 | 222 | 145% | 187% | 851% | 46 | 144 | 268 |
| REN | 26 | 40 | 128 | 55% | 223% | 491% | 14 | 88 | 125 |
| BNT | 18 | 12 | 77 | -33% | 550% | 479% | -6 | 66 | 85 |
| LRC | 21 | 27 | 79 | 31% | 194% | 393% | 6 | 52 | 81 |
| ZRX | 109 | 99 | 234 | -10% | 137% | 171% | -10 | 135 | 187 |
| REP | 97 | 110 | 181 | 13% | 65% | 120% | 13 | 71 | 117 |
| MKR | 424 | 328 | 461 | -23% | 41% | 8% | -96 | 133 | 33 |
| Total | -$26 | $835 | $1,120 | ||||||
Source: TradingView. As of 7/22/20.
Because “DeFi” just wasn’t quite capturing the hearts and minds like it needed to, the space came up with an ingenious new gimic – “yield farming”. If you haven’t read about it, you should. You can start here and here. Compound was sort at the heart of all this over the last month. You can read a bit about that here. Some issues already began popping up. Sam Bankman-Fried writes about one of them here. One DeFi protocol was hacked for $500k in June. Which is not the first time this year. In terms of DeFi names, we remain patient, objective, vigilant, and flexible towards the opportunity.
This is a busy chart but many of these support/resistance zones are multi-quarter or multi-year in length. They are areas of significant interest. The Stoch RSI on the bottom panel is a very simple momentum indicator. I drew that first yellow arrow the last week of February. Just drew the second one today.

Source: TradingView. As of 6/30/20.
The daily chart can be viewed as less ominous. Many are pointing to the series of lower highs and lower lows (yellow channel). And I get that.

Source: TradingView. As of 6/30/20.
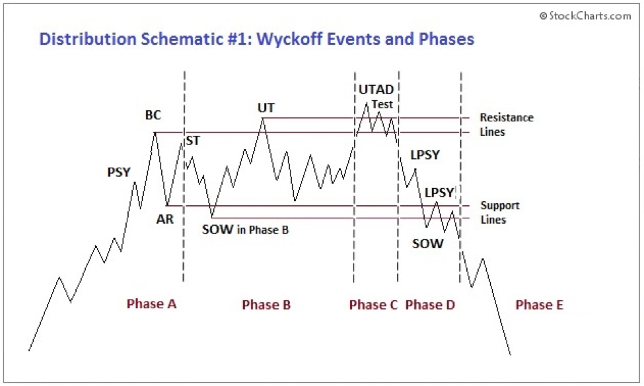
But a fair argument can be made that we’re still just ranging mid $8’s to low $10’s, and that price has had a hard time keeping an 8 handle for any significant amount of time for 2+ months. This also broadly seems to triangulate with PlusToken’s price sensitivity around selling BTC. Many are also pointing to what looks like a pretty clear Wyckoff distribution pattern. And I get that, although I’m not sure the volume profile fits.
What we can say with confidence is that this is not a highly levered Bitcoin market. Nothing like February 2020. Neither longs nor shorts have found themselves more than mildly offsides over the last 2+ months and neither are offsides currently. That means price action is more heavily driven by spot. This is healthy.
Grayscale has seen massive in-flows into its GBTC product, which now has >$4.1bn AUM. More BTC has been contributed into GBTC than has been mined since halving. While a significant amount of these GBTC subscriptions were in-kind and a significant amount specifically from Three Arrows Capital, the trend is undeniably bullish.

Source: Twitter @kerooke. As of 6/25/20.
Bitcoin’s realized volatility has collapsed to levels it has historically not stayed at for very long. There’s good reason to believe BTC’s realized volatility should and will continue to decrease significantly over the coming years. That being said, BTC is coiling right now and we will see expansion. Maybe not in July but it’s coming.

Source: TradingView. As of 6/30/20.
The rainy season in Sichuan has begun and the miner capitulation theme is over at least for the next couple months.

Source: Blockchain.com. As of 6/30/20.
Bitcoin options open interest climbed to its highest level on record by a wide amount into the June expiry, including a large portion on CME. Much of those strikes expired out of the money. It remains to be seen how much interest will be garnered in options in the weeks to come. We believe there was some amount of “tourist” length in Bitcoin after the Black Thursday washout with the upcoming halving and money printer going brrr. We think a good amount of that length came out as those options expired and as CME open interest has declined from recent highs. There may be some more length to come out still that is growing impatient from a lack of moon.

Source: Arcane Research. As of 6/26/20.
An all-time low amount of Bitcoin has moved in the last year. This is bullish.

Source: Coinmetrics & Ikigai. As of 6/30/20.
We’re not destroying many Bitcoin days. This is in-line with the prior graph and is bullish.
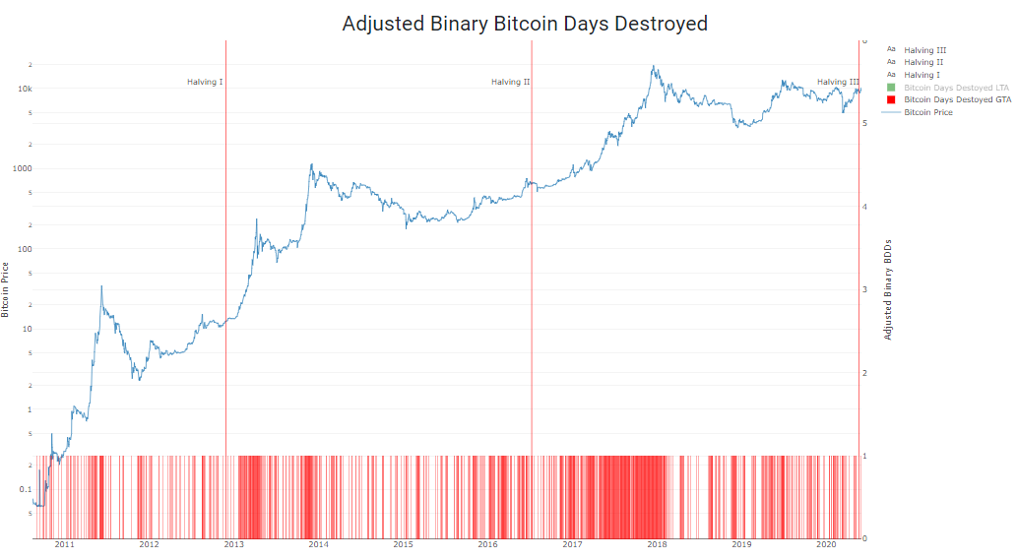
Source: Coinmetrics & Ikigai. As of 6/30/20.
Cross-coin correlation has broadly been declining from multiyear highs since mid-May. We interpret this as healthy, although it is nuanced. A number of large caps have lagged BTC since then. Also, ETH-BTC correlation remains above 0.85, which is to say, very high.

Source: Coinmetrics. As of 6/30/20.
The below chart is one of the best I’ve seen in explaining BTC’s correlation to SPX. YTD that correlation has picked up during times of stress (spiking VIX) and decreased during times of subdued stress (fading VIX). Straightforward situation and worth watching carefully.

Source: Twitter @caprioleio. As of 6/21/20.
Closing Remarks
We think there’s good reason to believe the S&P 500 will chop around for the next month or two, perhaps in the 2900-3300 range. The pace of QE has slowed significantly. The current fiscal stimulus in-place is running out and needs to be re-upped. It’s summertime.
Assuming SPX does chop for July and August, it makes good sense to assume BTC will chop with it, perhaps from mid-$8’s to low-$10’s where we’ve been for 2+ months. PlusToken continues to unload its stack of supply, keeping a lid on price. Then, right about the time PlusToken finally runs out of BTC to sell and volatility is coiled all the way up, the US government does more fiscal stimulus, finds a vaccine and punts a little extra QE for good measure - driving SPX to ATHs as BTC punches $10.6k while we head into election season. You could even get the extra boost of all that DeFi fast money flowing back into BTC. As it currently stands, we think that playbook makes sense.
On the flipside, what would a breakdown out of this multi-month consolidation range look like for BTC? What would be the backdrop for BTC with a 7 handle in July or August? Barring more aggressive selling from PlusToken or a Black Swan event, say Coinbase gets hacked for $500mm, it’s difficult for me to imagine BTC with a 7 handle without a significant pickup in traditional asset class stress. Which you could certainly see, but it’s not going to come out of nowhere. We laid out the macro factors to keep an eye on above. Don’t forget, it’s all one trade at the moment.
“If money be not thy servant, it will be thy master”

Travis Kling
Founder & Chief Investment Officer
Ikigai Asset Management
P.S.
Included below is an incomplete list of memorable tweets from the last month. Twitter is not investment advice and my views could easily be wrong. That being said, like it or not, Twitter matters for crypto. I have no interest in being a talking head for a living and babbling about on Twitter is a long way away from being a good steward of investor capital. However, this is a community with open-source software in its DNA, and participants want to crowd-source the truth. We believe we have built a team and a process that will produce these truths more quickly and more clearly than our competitors. We are shepherds of this technology. Answers to fundamental questions about this asset class are not currently clear, so having a public platform to share your views with the community is important. After all, you’re helping shape the future :)
1. Ikigai Asset Management is the trade name for a collection of advisory and consulting businesses operated by Travis Kling, Anthony Emtman, and their team.
The information contained or attached herein is not intended to provide, and should not be relied upon for, accounting, legal or tax advice or investment recommendations. This presentation may contain forward-looking statements that are within the meaning of Section 27A of the Securities Act of 1933 and Section 21E of the Securities Exchange Act of 1934. These forward-looking statements are based on management’s beliefs, as well as assumptions made by, and information currently available to, management. Although management believes that the expectations reflected in these forward-looking statements are reasonable, it can give no assurance that these expectations will prove to be correct. This email is for informational purposes only and does not constitute an offer to sell, or the solicitation of an offer to buy, any security, product, service of Ikigai as well as any Ikigai fund, whether an existing or contemplated fund, for which an offer can be made only by such fund’s Confidential Private Placement Memorandum and in compliance with applicable law. Past performance is not indicative nor a guarantee of future returns. Please consult your own independent advisors. All information is intended only for the named recipient(s) above and is covered by the Electronic Communications Privacy Act 18 U.S.C. Section 2510-2521. This email is confidential and may contain information that is privileged or exempt from disclosure under applicable law. If you have received this message in error please immediately notify the sender by return email and delete this email message from your computer. Copyright 2020 Ikigai Asset Management, LLC. All Rights Reserved.
NOT INVESTMENT ADVICE; FOR INFORMATION ONLY
PAST PERFORMANCE IS NOT A GUARANTEE OF FUTURE RESULTS
