
May 2022 - Monthly Market Update
/Monthly Update || May 2022
“Leverage magnifies outcomes but doesn’t add value”
Opening Remarks
Greetings from Ikigai Asset Management¹ headquarters. We welcome the opportunity to bring to you our forty-fourth Monthly Update and hope these are helpful in better understanding some of what we’re doing and what we’re seeing. We have the privilege of deploying capital on behalf of our investors into a new technology and asset class that already has and will continue to fundamentally change the world – continuing to create trillions of dollars of value in the process.
We believe we are obligated to be shepherds of this technology – to help the world better understand the powerful potential of DLT and crypto assets, and to fund and be an ambassador for DLT projects that will change our lives forever.
To that end, the Fed was in complete control of all asset prices in April, and crypto was no exception. With Y/Y CPI hitting 8.5% in March, the highest level since 1981, the Fed is in a full-blown inflation fighting frenzy.
“Don’t Fight The Fed” is an adage that’s been around since at least 2009 and “It’s All One Trade” has been around for at least the last two years. They both speak to the same backdrop – central bank actions in the current monetary regime have such an overwhelmingly powerful impact on all asset prices that everything else is just an afterthought. It’s that backdrop that produces a chart like this-

Source: TradingView. As of 4/30/22.
…Stifling correlation of BTC and NASDAQ as Fed officials continued their barrage of jawboning to spook inflation into slowing. It’s a rough backdrop that led to significant positive developments in the crypto markets in April being entirely ignored by price – because you Don’t Fight The Fed and It’s All One Trade.
Where the Fed, and in turn asset prices, might go from here we discuss in detail below, but I’d like to point out a couple critical factors for the current situation as it relates to crypto prices. There are plenty of market participants calling for much lower near-term prices in both equities and crypto. There’s growing chatter of <10k NDX and <$24k Bitcoin. Yeah it could happen, but it wouldn’t be my base case. Even if that type of “Goblintown” price action were to materialize, it would still be incomparable to the 2018 bear market. Fundraising in the crypto sector continues at a blistering pace - just check the Monthly Highlights below and view past Monthly Highlights here. This permanent capital WILL lead to innovation that WILL drive adoption – fundraising in 2018 & 2019 was a barren wasteland relative to what we’re seeing now. Yet that didn’t stop crypto market cap from growing more than >10x over the last couple years. Imagine the future growth with the current level of permanent capital investment.
The other critical factor for the current situation is that the cat is out of the bag in terms of what you want to own when the Fed eventually slows tightening. There’s nothing on planet Earth that will move faster off the bottom than crypto when the Fed even hints at slowing down. There has never been wider agreement on that fact than there is now. It’s nothing like 2018/2019 when most of the world’s capital had no idea what to think about this asset class.
That presents a conviction for the medium/longer-term horizon investor that will put a bid in crypto that makes Goblintown a difficult scenario for me to have as my base case. That’s because we can argue about whether Fed Funds gets up to 2.0% or 2.5% or 3.0% but everyone knows it’s a pit stop before rate cuts and more QE. And then once again Don’t Fight The Fed and It’s All One Trade going back in the other direction – but with more eyeballs, human capital and financial capital committed to this ecosystem than ever before.
Invest
Ikigai is currently fielding interest from new investors globally. We are open to international investors and qualified accredited U.S. investors (including self-directed IRAs).
We accept new investors on the 1ˢᵗ and 15ᵗʰ of every month.
Contact us to see if you qualify.
April Highlights
Central African Republic Passes Bill to Make Bitcoin Legal Tender
Fidelity to Allow 401(k) Accounts to Hold Bitcoin
Blockchain.com Raises Undisclosed Series D at $14bn Valuation Led by Lightspeed and Baillie Gifford
Bolt Acquires Crypto Payments Startup Wyre for $1.5bn
Circle Raises $400mm Led by Blackrock, Fidelity
Near Protocol Raises $350mm Led by Tiger Global
MicroStrategy Purchases $195mm of Bitcoin at ~$45,716
Sky Mavis Raises $150mm Led by Binance to Repay Ronin Bridge Hack
Indian Crypto Exchange Raises $135mm Series D at $2.15bn Valuation
Bored Ape Yacht Club Sells >$100mm of Digital Real Estate in <45 Minutes in New Metaverse Project Otherside
Lightning Labs Raises $70mm Series B Led by Valor Equity Partners
Pantera Closes New $1.3bn Venture Fund
Dragonfly Raises $650mm Venture Fund Led by Multiple Ivy Leagues, KKR
Framework Ventures Launches $400mm Fund Focused on Blockchain Gaming
Fabric VC Set to Close Two Web 3.0 Venture Funds Totaling $245mm
Bitcoin Payment Processor BitPay Announces Support for Lightning Payments
Robinhood to Integrate Lightning Network
Lightning Network Payments Company Strike Launches Shopify Integration
Tesla, Block and Blockstream to Launch Solar Powered Bitcoin Mining in Texas
Facebook to Introduce Virtual Tokens and Crypto to Its Family of Apps
Sony and Lego Invest $2bn Into Epic Games to Build Metaverse for Kids
ESPN Signs First Ever NFT Deal with Autograph
UFC to Pay Bonuses to Fighters in Crypto
Goldman Sachs Offers Its First Bitcoin-backed Loan Product
Crypto Lender Celsius to Cease Paying Interest on New Deposits in US
UK Government Announces Move Towards Embracing Crypto
US Treasury Sanctions Russian Crypto Miners in First Ever Mining Sanction
Stripe to Enable USDC Payments on Twitter
Fort Worth Begins Mining Bitcoin in City Hall
Apollo Hires Former JPMorgan Crypto Exec Christine Moy to Lead Crypto Investing
| Asset Class | Apr | Mar | Feb | Jan | YTD | Q4-21 | Q3-21 | Q2-21 | Q1-21 | 2021 | 2020 | Instrument |
|---|---|---|---|---|---|---|---|---|---|---|---|---|
| Bitcoin | -17% | 5% | 12% | -17% | -19% | 6% | 25% | -41% | 103% | 60% | 303% | BTC |
| NASDAQ | -14% | 5% | -5% | -9% | -21% | 11% | 1% | 11% | 2% | 27% | 48% | QQQ |
| S&P 500 | -9% | 4% | -3% | -5% | -13% | 11% | 0% | 8% | 6% | 27% | 16% | SPX |
| Total World Equities | -8% | 2% | -3% | -5% | -13% | 5% | -2% | 6% | 6% | 16% | 14% | VT |
| Emerging Market Equity | -6% | -3% | -4% | 0% | -13% | -3% | -9% | 3% | 4% | -5% | 15% | EEM |
| Gold | -2% | 1% | 6% | -2% | 3% | 4% | -1% | 3% | -10% | -4% | 25% | GLD |
| High Yield | -5% | -2% | -1% | -3% | -10% | -1% | -1% | 1% | 0% | 0% | -1% | HYG |
| Emerging Market Debt | -7% | -1% | -6% | -3% | -17% | -1% | -2% | 3% | -6% | -6% | 1% | EMB |
| Bank Debt | -1% | 0% | -1% | -1% | -2% | 0% | 0% | 0% | -1% | -1% | -2% | BKLN |
| Industrial Materials | -8% | 6% | 7% | 3% | 7% | 8% | 2% | 8% | 8% | 29% | 16% | DBB |
| USD | 5% | 2% | 0% | 1% | 8% | 1% | 2% |
-1% | 4% | 6% | -7% | DXY |
| Volatility Index | 64% | -32% | 21% | 44% | 94% | -26% | 46% |
-18% | -15% | -24% | 66% | VIX |
| Oil | 4% | 10% | 8% | 15% | 42% | 3% | 5% | 23% | 23% | 64% | -68% | USO |
Source: TradingView. As of 4/30/22.
Expectations, Positioning & Rate Of Change
This section is meant to be an update to the February 1st Monthly Update’s section titled “The Fed Who Cried Tightening”. It’s true that inflation measures have been moving up steadily from very depressed levels for the past year, but as it relates to events in the last three months that drive inflation and in turn Fed policy, the Ukraine/Russia conflict is the major new development. Three months ago, Ukraine was barely on anyone’s radar. The inflation implications of that conflict are now well understood and led to the highest US inflation prints in 40 years this month.
The chart below for context–

Source: @charliebilello. As of 4/29/22.
But I think asset price movements are about expectations, positioning and rate of change. To that end, we set the table for this discussion with this chart-

Source: Coingecko. As of 4/1/22.
The market is currently pricing in 10 rate hikes through the rest of this year. 50bps this coming week is virtually assured, and the market is currently pricing in a 94% probability of another 50bps in June and 92% probability of another 50bps in July. Next week we should also get an official start to Fed balance sheet rolloff, which was previewed in the latest Fed minutes release as growing to $95bn/month over the next few months.
Since It’s All One Trade, this level of tightening has crushed most all asset prices YTD. For bonds, we are in the longest drawdown ever (21 months) and the largest since 1980 (-11.1%).

Source: @charliebilello. As of 4/29/22.
The S&P 500 is off to its third worst start since 1928, but if history holds, stocks are highly likely to close the year higher than current levels.

Source: @charliebilello. As of 4/29/22.
When you combine those two performances, the 60/40 portfolio is having its worst year since 2008.

Source: Bloomberg. As of 4/30/22.
Tech stocks in particular have been smoked. The NASDAQ 100 had its worst month since October 2008.

Source: Tradingview. As of 4/30/22.
When viewed through the lens of drawdowns from the highs, the NASDAQ has only been in worse shape a few other times.

Source: @portfolio123. As of 4/29/22.
Tech stock volatility has now exceeded 2008 and approaching dotcom bust levels.

Source: @gavinsbaker. As of 4/12/22.
All of which has led to significant multiple compression for the NASDAQ.

Source: @charliebilello. As of 4/27/22.
The flipside to this bearish price action in stocks and bonds is the historic run for commodities. Off the Covid-crash lows, this commodity bull run has significantly outperformed the run in 07-08 prior to the financial crisis.
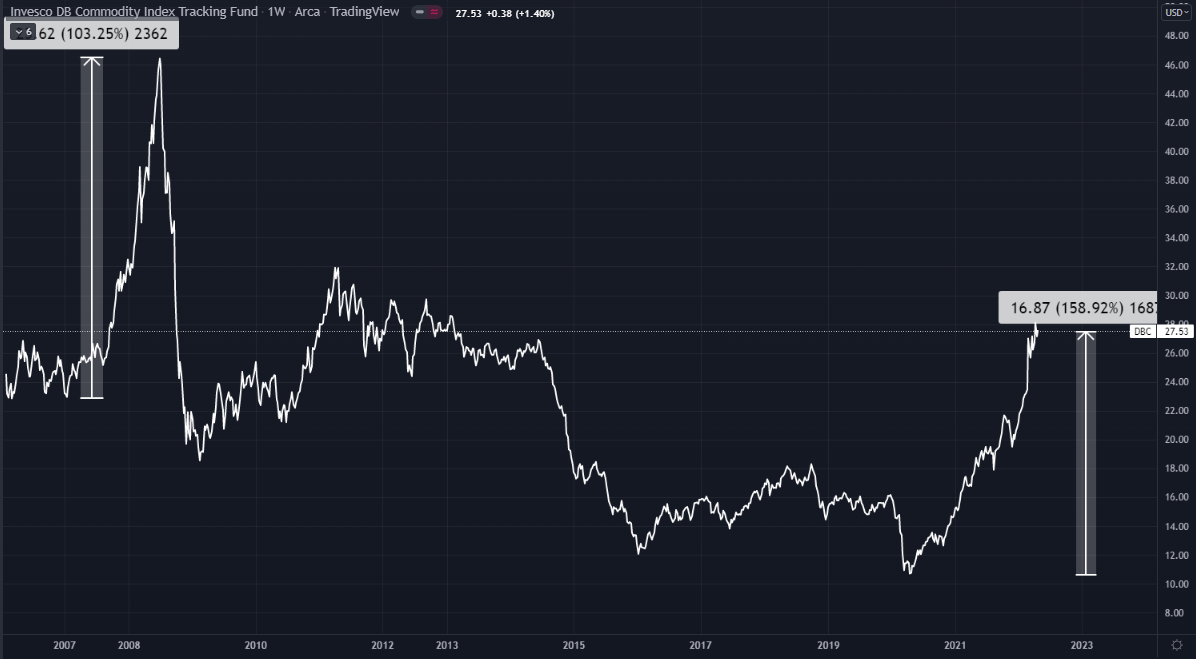
Source: Tradingview. As of 5/1/22.
And for all the love tech stocks and “work from home” got in response to Covid, at this point, you would have been significantly better off buying commodities at the bottom than the NASDAQ. Pretty wild.

Source: Tradingview. As of 5/1/22.
US bond volatility remains at Covid crash levels and firmly in the “danger zone”.
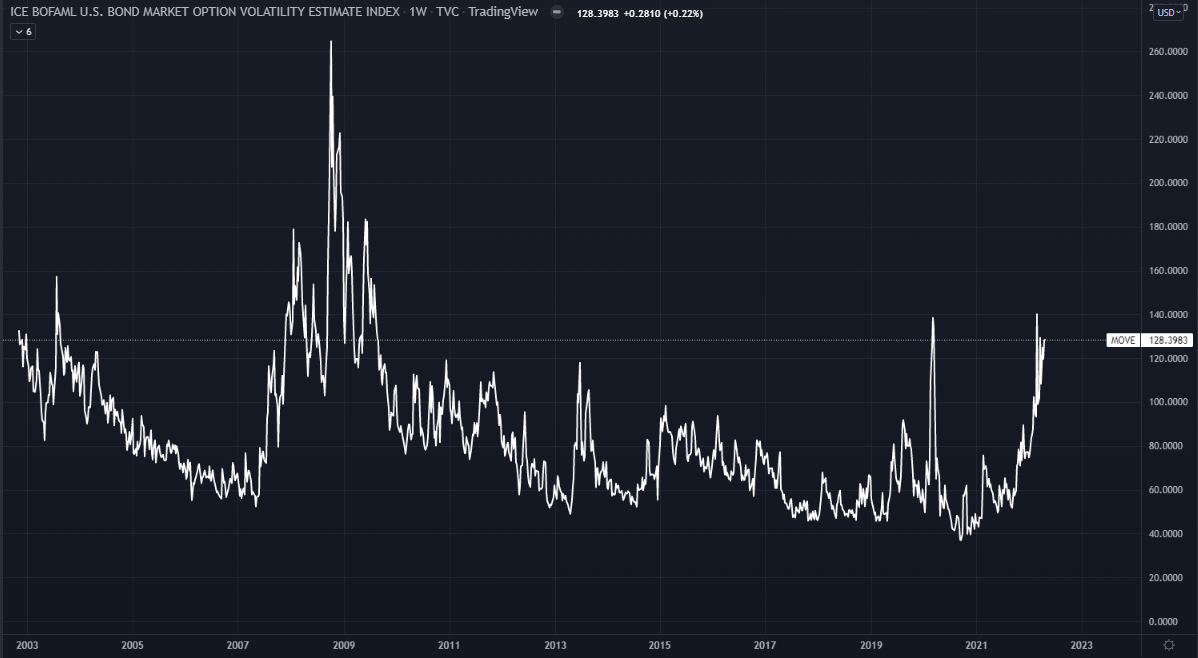
Source: Tradingview. As of 5/1/22.
US financial conditions (white) continue to tighten – exceeding late 2018 levels and nearing levels where they topped in 2016. You can see the accompanying SPX drawdowns in yellow.

Source: Tradingview. As of 5/1/22.
Since It’s All One Trade, when central banks tighten, economic growth starts sliding less than a year later. The chart below would indicate a PMI <50 by year-end.

As of 4/5/22.
All of this adds up to very bearish sentiment, and not without reason. March was the largest selling of tech stocks by hedge funds on record, and you’d think April is highly likely to be even worse.

As of April 7th, US hedge fund net exposure was in the 2nd percentile on a 1-year basis and 7th percentile since 2010.

The latest “AAII Bull-Bear Survey” showed sentiment at the third lowest level ever. The prior lowest level was the stone-cold bottom of the SPX during the financial crisis and the only other level was 1990, within 5% of a SPX bottom.

The latest “AAII Bull-Bear Survey” showed sentiment at the third lowest level ever. The prior lowest level was the stone-cold bottom of the SPX during the financial crisis and the only other level was 1990, within 5% of a SPX bottom.

Source: BofA. As of 4/12/22.
Want to see something crazy?

Source: Tradingview. As of 5/1/22. Excluded Sept 2001 because confidence level then was much higher than current.
When looking back at those periods of very low confidence, it called the absolute bottom in basically every instance. The upcoming confidence survey will very likely print a lower low (Q’s were -14% and 30 year fixed mortgage rates ripped). It’s noteworthy that in only one instance did the SPX decline a further 5% from the confidence survey lows, and it ripped hard right after that 5% decline.
The DXY is flirting with a breakout of its 7+ year range.

Source: Tradingview. As of 5/1/22.
There are a lot of eyes on Japan right now. The Yen is depreciating rapidly against the dollar as the BoJ sticks with it’s Yield Curve Control (in case you want a preview of what’s likely coming for the US).

Source: @KelvinSCWong. As of 5/1/22
I don’t have a view on what BoJ will do or where USDJPY and JGB yields go from here, but I do know that the world views these instruments as a type of risk barometer for potential problems to pop up in global financial markets. A volatile USDJPY can easily cause negative ripple effects across all asset classes.
It is significant that the ECB has made a recent hawkish pivot from extremely dovish policy, with Lagarde indicating a July rate increase is on the table. The market is now pricing in 75bps of rate hikes by year-end, from pricing in nearly none two months ago. Note the US Fed Funds next to it - both very significant recent moves.

Source: @econchart. As of 4/27/22
It makes sense that the ECB would be starting to tighten despite the Ukraine conflict. The US is rapidly tightening so EURUSD is on the lows of a 7+ year range.
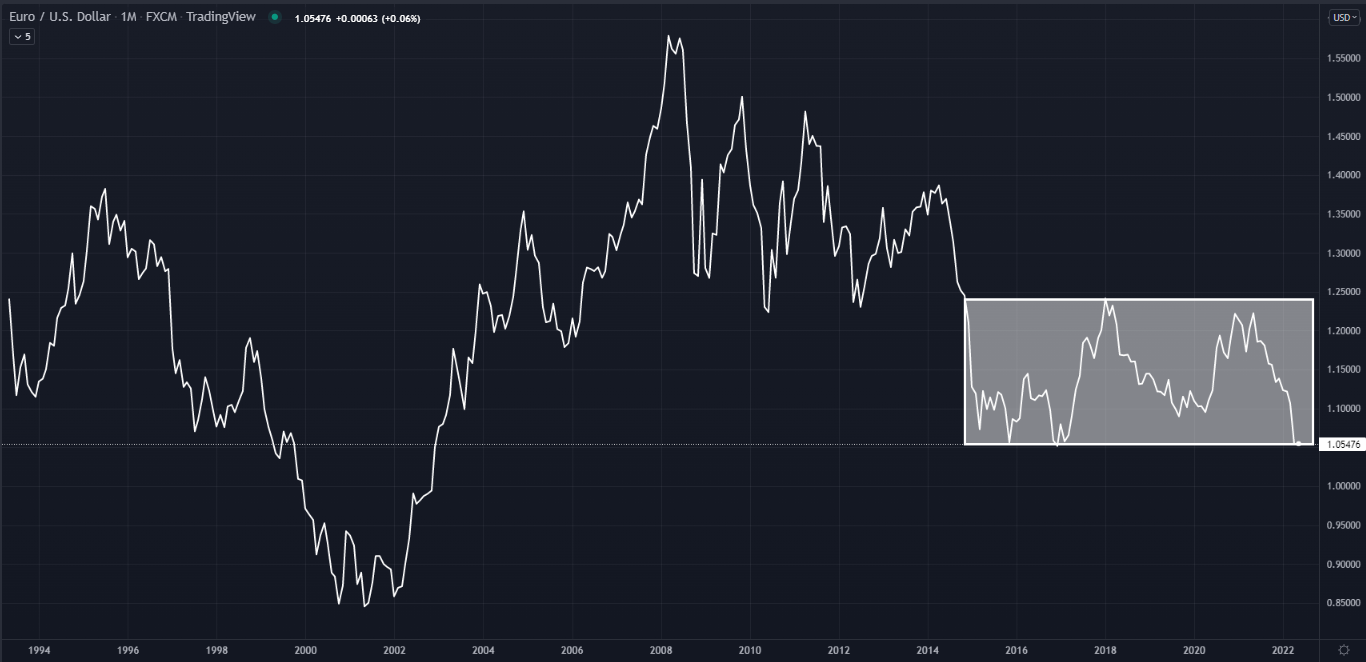
Source: Tradingview. As of 5/1/22.
There is a high degree of coordination amongst major central banks, with the Fed calling the shots. So where Powell goes others are essentially dragged along, at least directionally. Both the EURO and JPY are potential sources of risk that remain worth watching closely.
Despite the near-term inflation spike and all the volatility in the Treasury curve, longer-term inflation expectations have remained subdued.

Source: FRED. As of 4/29/22.
Yes, the 5Y5Y has moved up significantly off its extremely bearish Covid low and broken out of a 7+ year range, but it’s still basically in-line with the Fed’s long-term goal for inflation of 2%. Essentially this is saying there’s nothing to worry about with regards to permanent significantly higher inflation.
I’ll leave you with three more data points and then wrap this up – 1) US Govt Debt/GDP, 2) US Annual Deficit/GDP, and 3) US Private Sector Financial Assets/GDP.

Source: longtermtrends. As of 9/30/21.

Source: FRED. As of 2021.

Source: @macroalf. As of 4/5/22.
So What?
Expectations. Positioning. Rate of change. I think the evidence lines up that the Fed would not be able to hike 10 times in 2022 without crashing financial markets, but that they won’t have to before inflation and economic growth indicators roll over. If inflation stays stubbornly high that’s a real risk but it’s not my base case. The Ukraine conflict and China lockdowns will both matte for that.
The exact timeline and how painful the ride is on the way there is not clear. My base case is inflation and economic growth indicators roll over starting now through to August. If that were the case, by Jackson Hole or perhaps the September FOMC meeting, the Fed will have the cover they need by being “data dependent” to slow down the pace of tightening.
Risk assets broadly and crypto specifically may sniff the slowing of tightening in advance of the actual public announcement to do so. The market will be closely watching FOMC pressers, Fed minutes and leading inflation and economic growth indicators for clues about how aggressive the Fed can and will be.
For traditional asset classes, some sort of Sell In May slide followed by 3+ months of sideways “crabbing” makes sense to me. For crypto, a Sell In May event may look like a mini-crash followed by several months of crab. I would be surprised if crypto doesn’t have some sort of meaningful rally in the summer months, even if traditional is doing relatively nothing. If a slowdown in Fed tightening looks like it might be coming, even if pushed out into Q4-22, crypto will likely be the asset class where that view is initially expressed by the market. Because the cat is out of the bag in terms of what you want to own when the Fed eventually slows tightening – deep pockets are begging for lower crypto prices
Market Update – Liquid Crypto Asset Investing
Guest Author: Asher Montague-Warr
| Symbol | Apr | Mar | Feb | Jan | YTD | Q4-21 | Q3-21 | Q2-21 | Q1-21 | 2021 | 2020 |
|---|---|---|---|---|---|---|---|---|---|---|---|
| BTC | -17% | 5% | 12% | -17% | -19% | 6% | 25% | -41% | 103% | 60% | 303% |
| ETH | -17% | 12% | 9% | -27% | -26% | 23% | 32% | 19% | 160% | 399% | 469% |
| XRP | -28% | 4% | 26% | -26% | -29% | -10% | 31% | 23% | 161% | 278% | 14% |
| BCH* | -27% | 12% | 13% | -32% | -37% | -13% | -6% | -11% | 45% | 6% | 71% |
| EOS | -28% | 24% | -3% | -23% | -34% | -23% | -5% | -14% | 85% | 17% | 1% |
| BNB | -12% | 8% | 5% | -27% | -26% | 32% | 28% | 0% | 708% | 1269% | 172% |
| XTZ | -32% | 5% | 1% | -20% | -42% | -28% | 100% | -37% | 142% | 116% | 49% |
| XLM | -26% | 16% | -2% | -25% | -37% | -4% | -1% | -31% | 220% | 108% | 184% |
| LTC | -22% | 9% | 4% | -25% | -34% | -4% | 6% | -27% | 58% | 17% | 202% |
| TRX | -15% | 20% | 4% | -22% | -17% | -16% | 31% | -26% | 244% | 181% | 101% |
| Aggregate Mkt Cap | -19% | 9% | 9% | -20% | -23% | 13% | 33% | -23% | 146% | 186% | 301% |
| Aggregate DeFi* | -23% | 15% | 10% | -27% | -29% | 29% | 64% | -27% | 339% | 581% | 1177% |
| Aggr Alts Mkt Cap | -20% | 12% | 7% | -22% | -26% | 19% | 40% | 1% | 246% | 479% | 274% |
Source: CoinMarketCap. As of 4/30/22. BCH includes SV. Aggregate DeFi from Coingecko.
The last few months have been tumultuous times in the market to say the least. Crypto was easy money until last year; now, thanks to these volatile market conditions, most traders have been chopped up and confused as to what's next. The sentiment has been a mixed bag - from full-blown bearish “COVID crash vibes”, to “one-way tickets to the moon”. Because of this mixed sentiment we have been gifted a crab market. Volatility and trading volumes are compressing as BTC has remained range bound now between $38k and $47k for nearly three months.
Currently BTC correlation is inextricably linked to equities - solidifying the narrative that BTC is behaving as a risk-on asset. With the impending rate hike coming in May, the adage of “Don’t Fight The Fed” rings true and has been just as relevant on the way up with QE as it has on the way down with QT. Let’s deep dive into BTC technicals and try to uncover what is really going on under the hood.
Key Points
Bitcoin’s correlation with the S&P 500 has never been higher
Crypto open interest is still very high, indicating elevated leverage in the market
Funding has remained generally neutral with no real directional bias
Whale wallets are accumulating and seem less price sensitive
DXY is in a bullish trend but approaching resistance, which could cause crypto to rally should the DXY roll over
The VIX is elevated and indicative of a lot of fear in traditional markets
Bitcoin price is holding at production cost for miners so far
I will present a bear thesis and a bull thesis. First, bears will argue we are in a bear flag in a larger ABC corrective wave with an equal measured move yet to come.
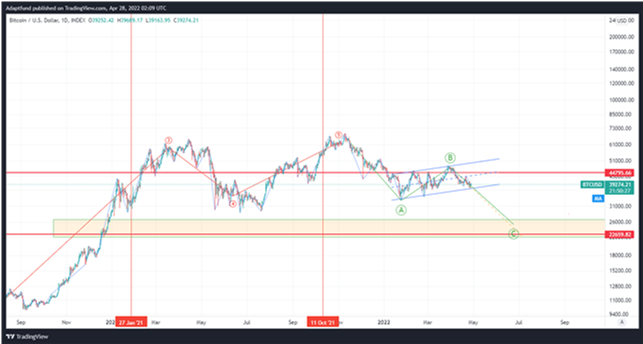
If this is the case then we could be looking at a drop back under the previous low on the 21st of July 2021 at the price of $28,700 – an equal measured move would take it to ~$26k, bringing the total correction to ~60% from recent BTC highs and firmly putting BTC into a bear market for some time ahead. This scenario could well be in the cards as a potential deleveraging event. One way we can check this possibility is to look at open interest-

Source: Coinalyze. As of 4/29/22.
The above chart shows the aggregate total number of outstanding derivatives across all exchanges. We can see that currently Open Interest is at $7.3bn contracts open. As a reminder, for every long contract open there is a short and vice versa, so important questions to ask are: are bears or bulls in control? How long or short is the market maker positioned? Have shorts or longs been more aggressive and for how long? These are difficult questions to answer with confidence. We do see that every time the price dips, a good number of those contracts are cleared off the books before reloading. Could it be that the market has become too complacent and programmed to buy the dip only in store for a rude awakening? For a full leverage flush, one would expect Open Interest to come back to the previous lows at around $2.4bn contracts. Whether we get it will likely be a function of the Fed.

Source: TradingView. As of 4/29/22.
The above chart shows the correlation between BTC and the VIX. The VIX is often referred to as the fear and greed index. When the VIX is high, extreme fear is in the market and is indicative of the general health of traditional markets. We can see we’ve had a very choppy VIX the last few months and it appears to be gradually rising. This could lead to an eventual spike which would then mark the bottom of this downturn, commonly referred to as capitulation.

Source: Coinalyze. As of 4/29/22.
Aggregated BTC funding rates shown above have remained neutral to marginally bullish with very little directional bias. Generally, it is better to wait for a larger move in one direction or the other to provide a clear direction of where the market is heading. For now, it appears to be a no trade zone.

Source: TradingView. As of 4/29/22.
Above is the bull scenario. Bulls would argue we are in an ascending triangle pattern and a complex 4th wave - leading to an eventual 5th wave up to $100k or beyond. It’s a nice-looking chart. The structural waves seem to match but is it really re-accumulation? We can turn to on-chain metrics to potentially help us uncover the answer.

Source: Glassnode. As of 4/29/22.
This chart represents the number of whale wallets (wallets >1,000 BTC) on the Bitcoin blockchain accumulating or distributing. You see a clear divergence in the behavior of these wallets with the price moving down and whale wallets in steady accumulation. While this looks encouraging, it could climb higher from here while price chops or declines. An accumulation spike up into a price crash would be very bullish.

Source: TradingView. As of 4/29/22.
The meteoric rise in the Dollar is something we have been keeping a keen eye on. I believe it’s one of the most influential macro factors in the market right now. Most crypto maximalists wouldn’t like to think that the dollar has much impact, but with crypto’s correlation to macro being so high right now, it’s hard to ignore. The rise in the dollar is not just affecting crypto its affecting traditional markets too.
One things crypto bulls are looking at is the DXY topping out, as that can also help to lift BTC prices. The dollar is approaching strong resistance and is expected to pull back. If on the other hand it breaks up, then upside targets for the DXY could be in the region of 120, which would be a bearish backdrop for Bitcoin.
Inverse correlation between SPX and DXY.

Source: TradingView. As of 4/29/22.
The below model illustrates how BTC price gravitates towards its cost of production. This is in accordance with the concept being mentioned by Satoshi Nakamoto in the white paper.

Source: TradingView. As of 4/29/22.
We can see with the upper purple line that the total production cost floor is currently holding and acting as support. Should this break down, we will likely go to the red line which is the electricity cost of production only. Historically buying at either one of these lines has ended up with positive returns.
Summary
The bullish setup likely depends on the Fed meeting this week. I can imagine a scenario for a bullish outcome that could send BTC back into the high $40’s but it wouldn’t be my base case. I think it depends on a few factors-
Fed communication is dovish relative to quite bearish expectations, which could happen
A DXY pullback, which could happen
A BTC short squeeze due to extreme funding rates and open interest staying low, which is less likely to happen from current levels
As for the near-term bearish scenario, at time of writing the bear flag appears to be on the verge of a breakdown. Should this happen, we will probably see real panic in the market which should lead to a total washout in leverage within the derivative markets. Once that happens, I believe we should begin to formulate a bottom. From what I can see on-chain, the supply is dwindling. Exchanges are seeing outflows of BTC faster that we’ve seen in previous years. There’s clear accumulation among whale wallets over 1,000 BTC who are typically less price sensitive. This paints a positive picture in the long term and sets up for golden years ahead, as it is apparent institutional interest is here.
Closing Remarks
I had the opportunity to spend a few days in the Bahamas this week at FTX’s first-ever conference. Hats off to them for putting on a great event. It was really cool to see what an obviously large impact FTX is already having on the country. The conference was noteworthy in numerous ways compared to the many conferences I attended in 2018 and 2019. The seriousness of the attention being paid to this asset class by the most important entities on the planet was palpable. The sheer volume of wealth and influence was palpable. The excitement about the future was palpable. The conviction on the future was palpable. 2019 conferences lacked all of that.
The crypto ecosystem is certainly not without its challenges, but it is also not without the willingness to fund solutions to those challenges. It will do that in a Cambrian explosion type of manner like it has been for years, except with more force than ever behind it this time. So little is set in stone about the future of this asset class and technology and its effect on humanity. There are money grabs. Pointless projects. Ponzi’s. Bad actors. Ruthless hackers. Ineffective token designs. Doomed technology roadmaps. Wasted money.
All that and yet my conviction on this asset class and technology and it’s potential to make the world a better place is completely unwavering. My conviction has never been higher. Portions of crypto’s future I would deem almost inevitable. It’s almost inevitable that the market cap of the crypto ecosystem will grow aggressively in the coming years and decades. If I were looking at the internet in 1998 I wouldn’t expect to have any more conviction in its future then than I have on crypto’s future now.
I believe the innovation of the internet has been objectively good for humanity up until this point, but it certainly isn’t without its problems. I believe the innovation of money (relative to bartering) has been objectively good for humanity up until this point, but certainly isn’t without its problems. I believe decentralization CAN help alleviate both the problems with the internet and the problems with the money, but it is not yet certain that will. That outcome is incumbent on the people working with those interests in mind. Fed rate hikes do nothing to alter that vision.
“It’s easier to give birth than to think about it.”
– Japanese Proverb
Travis Kling
Founder & Chief Investment Officer
Ikigai Asset Management
P.S.
Included below is an incomplete list of memorable tweets from the last month. Twitter is not investment advice and my views could easily be wrong. That being said, like it or not, Twitter matters for crypto. I have no interest in being a talking head for a living and babbling about on Twitter is a long way away from being a good steward of investor capital. However, this is a community with open-source software in its DNA, and participants want to crowd-source the truth. We are shepherds of this technology. Answers to fundamental questions about this asset class are not currently clear, so having a public platform to share your views with the community is important. After all, you’re helping shape the future :)
1. Ikigai Asset Management is the trade name for a collection of advisory and consulting businesses operated by Travis Kling, Anthony Emtman, and their team.
The information contained or attached herein is not intended to provide, and should not be relied upon for, accounting, legal or tax advice or investment recommendations. This presentation may contain forward-looking statements that are within the meaning of Section 27A of the Securities Act of 1933 and Section 21E of the Securities Exchange Act of 1934. These forward-looking statements are based on management’s beliefs, as well as assumptions made by, and information currently available to, management. Although management believes that the expectations reflected in these forward-looking statements are reasonable, it can give no assurance that these expectations will prove to be correct. This email is for informational purposes only and does not constitute an offer to sell, or the solicitation of an offer to buy, any security, product, service of Ikigai as well as any Ikigai fund, whether an existing or contemplated fund, for which an offer can be made only by such fund’s Confidential Private Placement Memorandum and in compliance with applicable law. Past performance is not indicative nor a guarantee of future returns. Please consult your own independent advisors. All information is intended only for the named recipient(s) above and is covered by the Electronic Communications Privacy Act 18 U.S.C. Section 2510-2521. This email is confidential and may contain information that is privileged or exempt from disclosure under applicable law. If you have received this message in error please immediately notify the sender by return email and delete this email message from your computer. Copyright 2021 Ikigai Asset Management, LLC. All Rights Reserved.
NOT INVESTMENT ADVICE; FOR INFORMATION ONLY
PAST PERFORMANCE IS NOT A GUARANTEE OF FUTURE RESULTS
