
July 2025 - Monthly Market Update
/Monthly Update || July 2025
“To me, risk is the most interesting, challenging and essential aspect of investing.”
Opening Remarks
Greetings from Ikigai Asset Management¹. We welcome the opportunity to bring to you our eighty-second Monthly Update and hope these are helpful in better understanding some of what we’re doing and what we’re seeing. We have the privilege of deploying capital on behalf of our investors into a new technology and asset class that has tremendous potential to make the world a better place and create trillions of dollars of value in the process.
We believe we are obligated to be shepherds of this technology – to do our part to push crypto towards fulfilling its potential. We strive to be an objective, reasonable, well-intentioned voice of truth amongst a chorus of biased, fallacious, pernicious opportunists. It’s an honor that we take seriously.
To that end, June was a month where Israel launched a large-scale attack on Iran; Iran retaliated; and a week later, the US launched a targeted air attack to destroy three Iranian nuclear facilities. War is always bad. Many lives were lost in this conflict. I pray for lasting peace in the region.
But this is a markets-focused letter, and from that perspective, markets took this conflict incredibly well, all things considering. If you told me the US was going to drop six 30,000lb bunker busters plus dozens of other missiles on three Iranian nuclear facilities, and then asked me what NASDAQ was going to do, I definitely wouldn’t have guessed +6%. But that’s what we got.
The good news is, the Iran situation at the moment appears to have calmed down, although it remains fragile. On June 24th, Israel and Iran agreed to a ceasefire, a deal brokered by Trump and Qatar. So far this has held, even while tensions remain high. If the ceasefire continues to hold, this event certainly has to be considered a win for humanity globally. A world where Iran has no nuclear capabilities is a better world to be in.
Crypto prices were flattish in June. BTC up a couple %. ETH down a couple %. Most other names somewhere pretty close to there. That’s pretty good performance in a month where significant conflict broke out in the middle east, but pretty light relative to how well stocks performed.
There has been plenty of chatter about BTC’s somewhat weak price performance (flat over the last six weeks) given how much public buying of BTC has been going on. Saylor, the ETFs, Metaplanet, Pomp’s SPAC, GameStop, etc. Billions of dollars buying BTC, recently, but price today is the same price as January 20th. What gives? We’ll get into that in more detail below.
June Highlights
Circle Goes Public in Massively Successful IPO – Raises $1bn at $31/sh, Trades to $300 in Two Weeks
MSTR Buys $1.8bn of BTC in Five Separate Tranches
Pomp’s SPACE ProCap Announces $1bn Merger with Publicly Traded CCCM, Raises $750mm, Buys $500mm of BTC
Metaplanet Buys $550mm of BTC in Four Tranches, Now Holds $1.3bn BTC
French Listed “The Blockchain Group” Buys $70mm of BTC
GENIUS Stablecoin Bill Passes Senate, Moves to House
RobinHood Launches Tokenized Stocks on New RobinHood L2 Based on Arbitrum
SEC Asks SOL ETF Issuers to Update S-1’s, Presumably in Advance of Approvals
SEC Scraps Gensler-era DeFi Exchange and Custody Rule Proposals
Director of US FHFA Issues Order Directing Fannie and Freddie to Consider Crypto as Collateral for Home Mortgages
JPMorgan Announces Pilot Program of Tokenized Bank Deposits Called JPMD on Base
JPMorgan Announces Plans to Offer Borrowing Against Crypto ETFs
Gemini Files Confidential S-1, Preparing for IPO
Crypto Conglomerate “Bullish” Files S-1, Preparing for IPO
Trump’s Truth Social Files for Several Crypto ETFs
Texas Becomes Third State to Sign BTC Treasury Reserve Bill into Law, Following Arizona and New Hampshire
Prediction Market Kalshi Raises $185mm Series C at $2bn Valuation, Led By Paradigm, Multicoin
Galaxy Raises $175mm Venture Fund
Publicly Traded SharpLink Gaming Buys $463mm of ETH with Previously Announced Private Placement Capital Raise
Stripe Acquires Crypto Wallet Privy
| Asset Class | Jun | May | Apr | Q1-25 | YTD | 2024 | Q4-24 | Q3-24 | Q2-24 | Q1-24 | 2023 | 2022 | Instrument |
|---|---|---|---|---|---|---|---|---|---|---|---|---|---|
| Bitcoin | 2% | 11% | 14% | -12% | 15% | 121% | 48% | 1% | -12% | 69% | 155% | -64% | BTC |
| NASDAQ | 6% | 9% | 1% | -8% | 8% | 25% | 5% | 2% | 8% | 8% | 54% | -33% | QQQ |
| S&P 500 | 5% | 6% | -1% | -5% | 5% | 23% | 2% | 6% | 4% | 10% | 24% | -19% | SPX |
| Total World Equities | 4% | 6% | 0% | -1% | 9% | 14% | -2% | 6% | 2% | 7% | 19% | -20% | VT |
| Emerging Market Equity | 5% | 4% | 0% | 4% | 15% | 4% | -9% | 8% | 4% | 2% | 6% | -22% | EEM |
| Gold | 1% | 0% | 5% | 19% | 26% | 27% | 0% | 13% | 5% | 8% | 13% | -1% | GLD |
| High Yield | 2% | 1% | 0% | 0% | 3% | 2% | -2% | 4% | -1% | 0% | 5% | -15% | HYG |
| Emerging Market Debt | 2% | 1% | -1% | 2% | 4% | 0% | -5% | 6% | -1% | 1% | 5% | -22% | EMB |
| Bank Debt | 0% | 1% | 0% | -2% | -1% | -1% | 0% | 0% | 0% | 0% | 3% | -7% | BKLN |
| Industrial Metals | 8% | 3% | -7% | 2% | 5% | 3% | -9% | 3% | 12% | -2% | -6% | -13% | DBB |
| USD | -3% | 0% | -4% | -4% | -11% | 7% | 8% | -5% | 1% | 3% | -2% | 8% | DXY |
| Volatility Index | -9% | -25% | 11% | 28% | -3% | 39% | 4% | 34% | -4% | 4% | -43% | 26% | VIX |
| Oil | 9% | 6% | -18% | 2% | -3% | 13% | 10% | -13% | 1% | 18% | -5% | 29% | USO |
SOURCE: TRADING VIEW. AS OF 6/30/25.
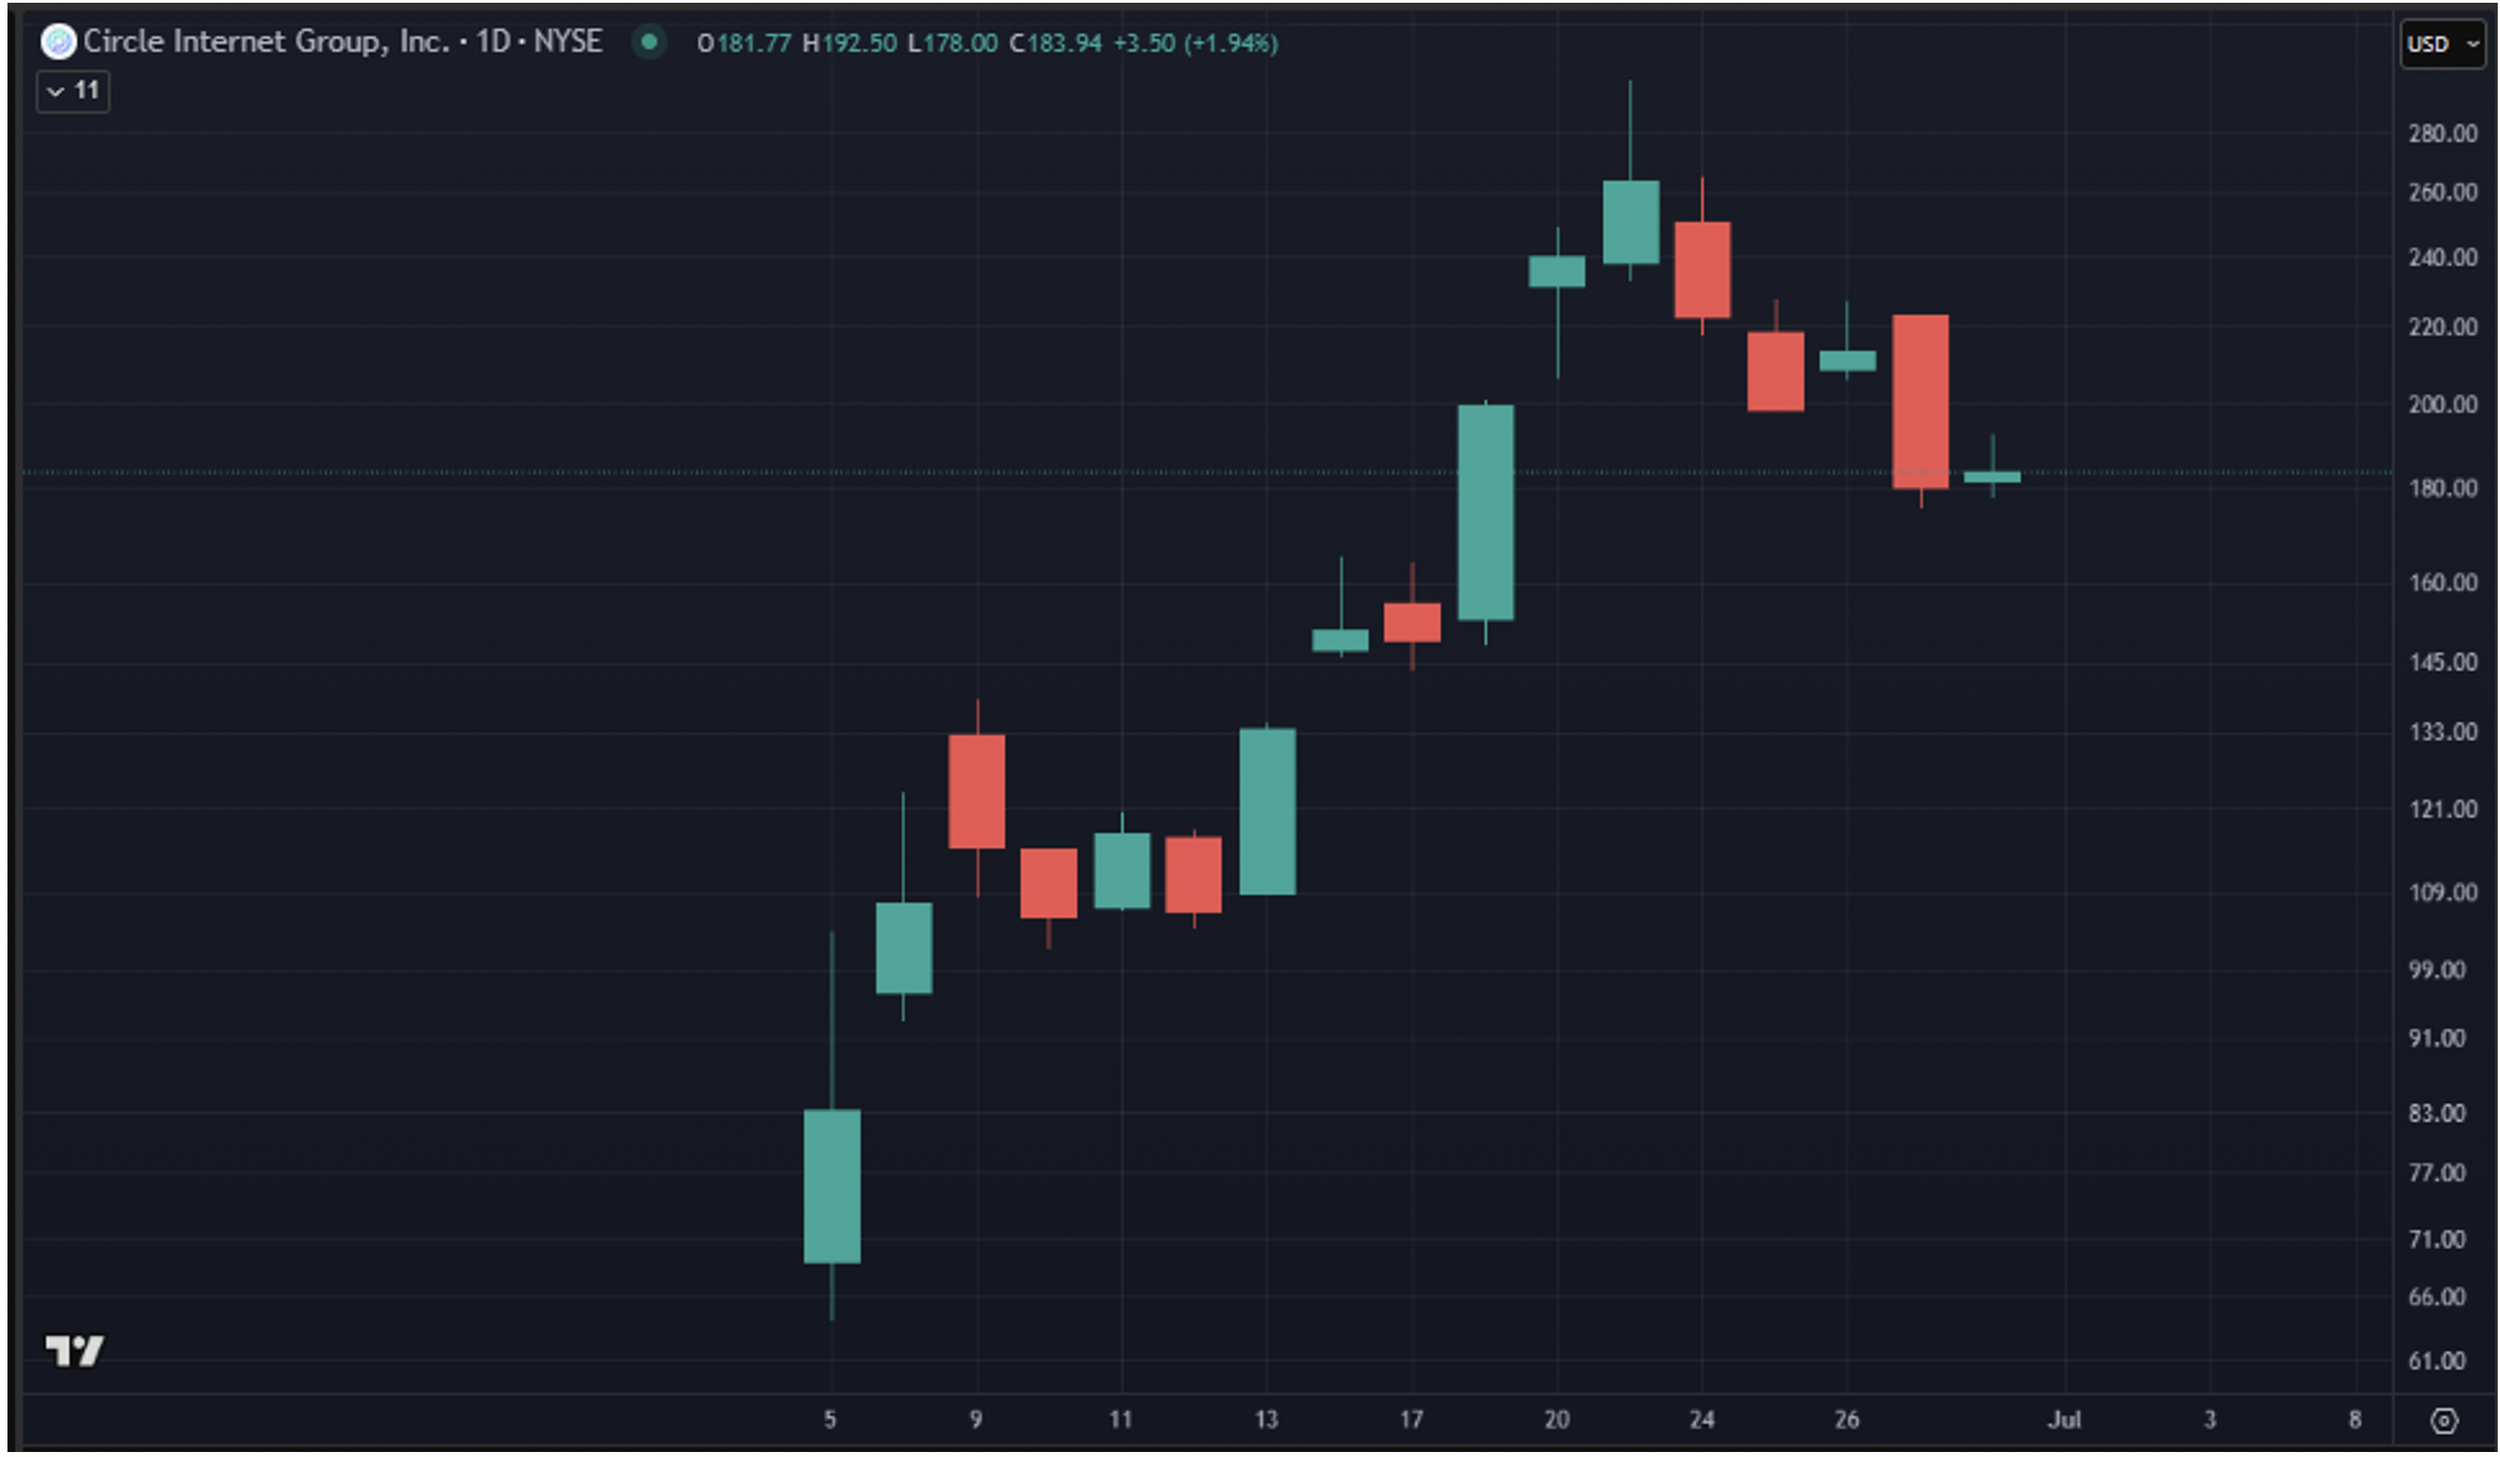
The Most Successful IPO In Decades
The overall headline event for crypto in June was the Circle IPO. CRCL IPO’d on June 5th at $31/sh, a $6.8bn valuation. The IPO was said to have been 25x oversubscribed. The stock opened at $69 and closed the first day at $83.23, marking at 168% return from IPO price on opening day. CRCL closed the second day of trading at $108. Over the following 10 trading days, CRCL ran to $300. That is the best performance of ANY IPO SINCE 1980. Crazy, huh?
Source: tradingview. As of 6/30/25.
Now, the stock did pull back from its late June highs, closing out June at $180 – 40% off its peak. But that’s still +580% from the IPO price and +216% from day one closing price. Circle is currently valued at $58bn – that’s bigger than FedEx. Bigger than Aflac.
CRCL, at current prices, is nowhere in the ballpark of “cheap” by any sort of fundamental metric. CRCL’s 2024 revenue and EBITDA were $1.68bn and $285mm, respectively. So CRCL is trading at 34x revenue and 203x 2024 EBITDA. NVDA trades at 63x and 111x 2024 revenue and EBITDA, respectively – but with a significantly higher revenue and EBITDA growth trajectory than CRCL. So CRCL is, uhh, quite pricey up here.
What are the takeaways from the second (admittedly distant second) largest stablecoin issuer having the best performing IPO since 1980?
The first thing we can say is that the Circle management team timed this incredibly well. Kudos to them for that. They waited until Trump was in office. They waited until Trump had appointed many strong supporters of crypto to various cabinet and regulatory positions. They waited until the GENIUS bill had been cleaned up and was on the verge of passing the Senate. They waited until Trump, many other politicians/regulators and many Wall St titans had sung the praises of stablecoins and their importance to US dollar dominance. Smart.
Second, the CRCL IPO gave us a glimpse into how hungry tradfi investors are for exposure to LEGIT crypto businesses. We already knew tradfi had tremendous demand for BTC price exposure via the ETF inflows. We already knew that MSTR and their copycats had found large pockets of demand for transformed BTC price risk. The proof is in the billions of dollars that have been raised in these sorts of instruments.
But now, with the CRCL IPO, we can see just how much more demand is still pent up. It’s an interesting juxtaposition against an Alt token market that has generally trailed BTC price performance so badly. It’s pretty clear there is very limited demand for the very large majority of Alts. But Circle isn’t an Alt. It’s a company with revenue and earnings and a CEO and a board and an auditor and public filing requirements and all that. And it just so happens to be a stablecoin issuer.
Which brings me to my next point. Stablecoins have product-market-fit. USDT has a $157bn market cap and USDC has a $62bn market cap. Stablecoins move more value than Visa. All of that BEFORE we even got proper regulation on them in the US. It’s a pretty safe bet that stablecoin proliferation is set to continue on the back of the GENIUS bill passing.
BTC has product-market-fit. You give tradfi access to that via the ETFs, and you get the hottest ETF launches ever, by far. Stables have PMF. You give tradfi access to that via CRCL, you get the hottest IPO since 1980. You give tradfi access to crypto stuff that has PMF, and apparently they will eat it up… TBD on what that next crypto use case to get PMF will be.
Which brings me to my last point. There’s more of this on the way. Kraken should be coming down the pipe soon. Crypto companies will try to tap public markets until the public markets won’t take any more. Speaking of, Gemini and “Bullish” both filed S-1’s in June. Those are two businesses that aren’t nearly as legit as CRCL, with Bullish being drastically less legit. Kraken should go off fine. Gemini tougher but maybe. If Bullish actually IPO’s, sell everything because there are no more marginal buyers left.
Market Update - Liquid Crypto Asset Investing
| Jun | May | Apr | Q1-25 | YTD | 2024 | Q4-24 | Q3-24 | Q2-24 | Q1-24 | 2023 | 2022 | |
|---|---|---|---|---|---|---|---|---|---|---|---|---|
| BTC | 2% | 11% | 14% | -12% | 15% | 121% | 48% | 1% | -12% | 69% | 155% | -64% |
| ETH | -2% | 41% | -2% | -45% | -25% | 46% | 28% | -24% | -6% | 60% | 91% | -67% |
| XRP | 3% | 0% | 5% | 0% | 8% | 238% | 240% | 29% | -24% | 2% | 81% | -59% |
| BCH* | 19% | 11% | 21% | -31% | 10% | 36% | 25% | -12% | -44% | 121% | 157% | -75% |
| EOS | -12% | -4% | 9% | -20% | -26% | -8% | 50% | -11% | -48% | 30% | -2% | -72% |
| BNB | 0% | 10% | -1% | -14% | -6% | 124% | 24% | -3% | -4% | 94% | 27% | -52% |
| XTZ | -6% | 3% | -15% | -49% | -58% | 28% | 82% | -11% | -43% | 40% | 39% | -84% |
| XLM | -10% | -3% | 3% | -20% | -28% | 157% | 237% | 8% | -35% | 9% | 81% | -73% |
| LTC | -1% | 4% | 1% | -19% | -17% | 42% | 54% | -11% | -28% | 44% | 4% | -52% |
| TRX | 5% | 8% | 3% | -6% | 10% | 136% | 63% | 25% | 1% | 14% | 98% | -28% |
| Aggregate Mkt Cap | 1% | 11% | 10% | -19% | 1% | 96% | 46% | -4% | -14% | 63% | 119% | -64% |
| Aggregate DeFi* | -5% | 28% | -1% | -19% | -4% | 50% | 52% | -15% | -21% | 47% | 132% | -77% |
| Aggr Alts Mkt Cap | 2% | 7% | 14% | -34% | -17% | 72% | 47% | -13% | -15% | 58% | 90% | -64% |
SOURCE: COINMARKETCAP AND COINGECKO. AS OF 6/30/25. BCH INCLUDES SV.
BTC was +2% in June with NASDAQ +6% and SPX +5%. Like I said earlier, that’s pretty weak performance for BTC relative to stocks. We’ve talked about this multiple times in prior letters, but BTC does just seem to get quite sluggish over $100k.
Granted, June brought us not one, but two test-and-holds of $100k as support–

Source: TradingView. As of 6/30/25.
That’s good news. It’s also good news that BTC has not closed under $100k since May 7th, it’s longest streak to-date. On the flipside, you’ll notice that BTC price also made two lower lows (for the moment) in the month of June. There’s a chance you could be forming a descending triangle around $100k.
So where does that put BTC for the “cycle”? As I’ve spoken about before, I don’t think it’s too terribly helpful to continue thinking about BTC price action in terms of halving cycles. I think that’s been true for more than five years at this point. I’d be more focused on the global liquidity cycle, and where central banks and governments are regarding interest rates and money printing.
From that perspective, things looks good, at least in the near term. As evidenced by the most posted chart on Crypto Twitter-
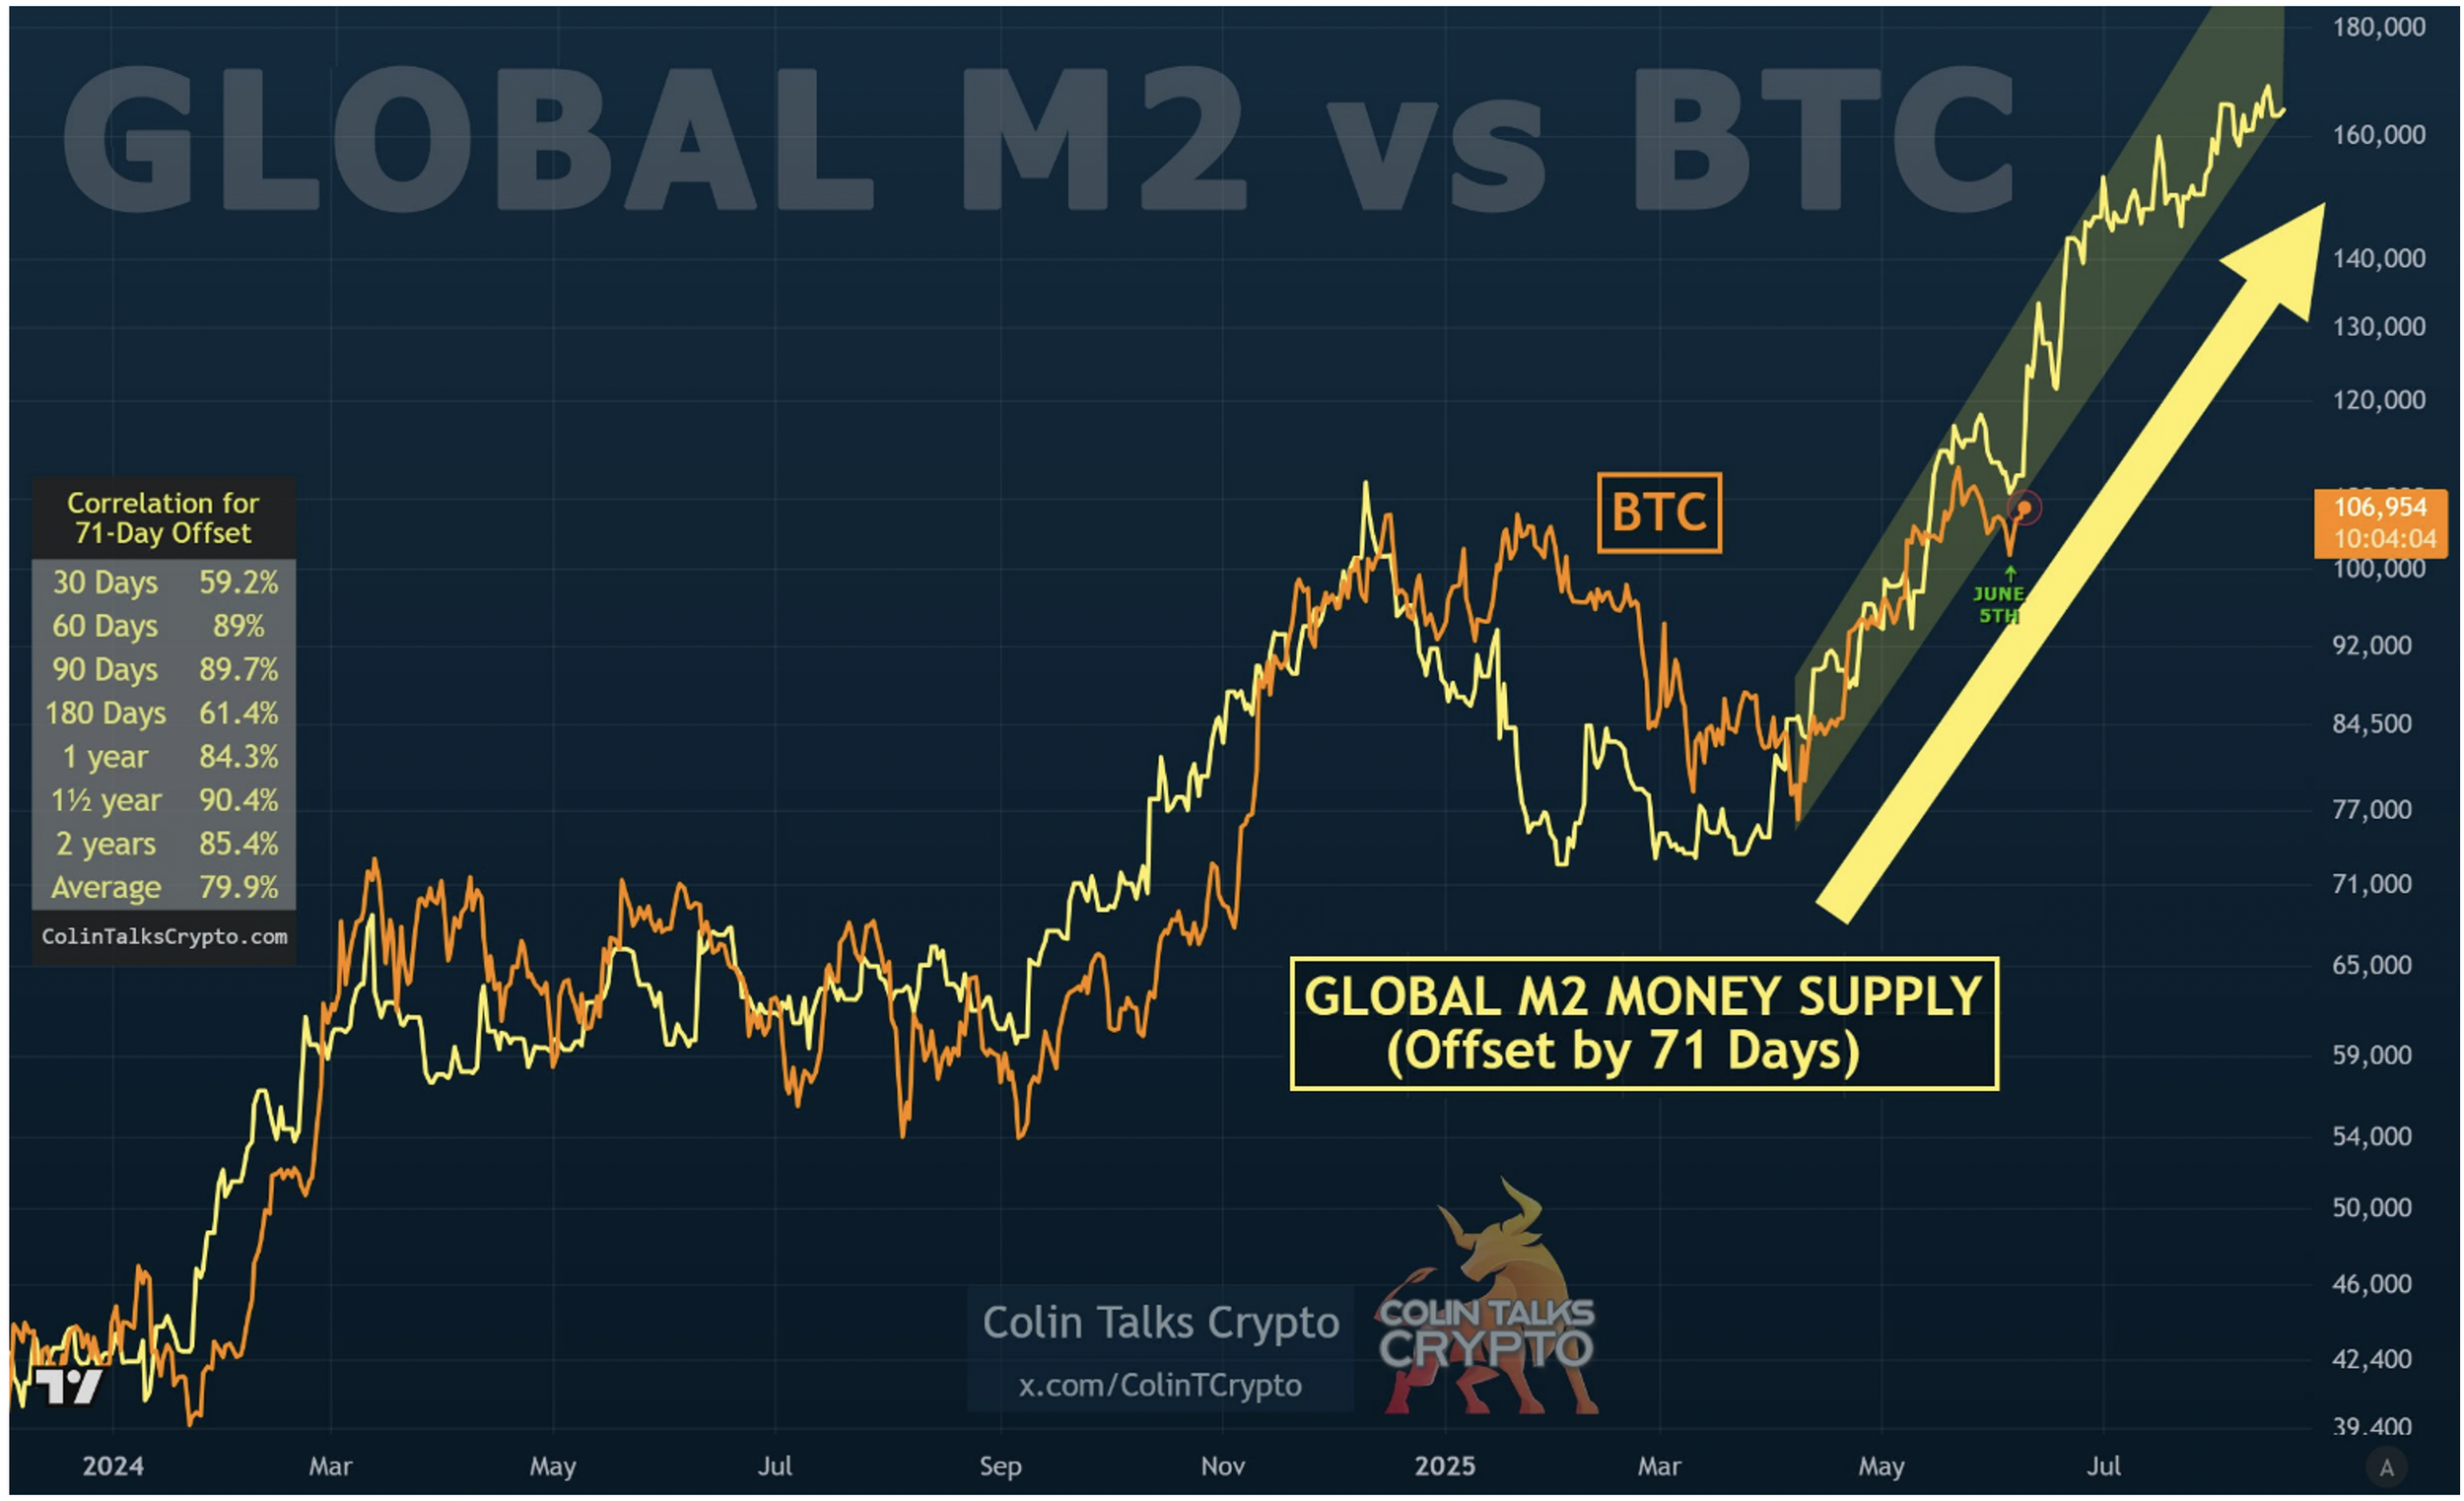
Source: @colintcrypto. As of 6/9/25.
Global M2 has moved significantly higher in the last 4+ months. And when you lag that against BTC price (by 71 days in the above chart), it predicts BTC price will move considerably higher, starting immediately.
Is that my base case? $150k+ BTC by Labor Day? It is not. It would not be my base case that we see $150k this year. But I’m also not expecting a strongly negative year next year for BTC either, which would be predicted by the “3 up 1 down” BTC halving cycles. To me, it seems like we’re in a period where directionally, monetary and fiscal policies are set to ease, not tighten in the coming quarters. Once we get to May 2026, Powell is out and whoever Trump puts in will almost assuredly be dovish. So there’s good reason to think 2026 will be a year of interest rate cuts.
And with DOGE, we had a handful of months in there where it looked like maybe the US government was going to rein in spending in a meaningful way. That now appears to have been a short-lived fluke. The US government will keep spending at approximately the same rate it has been, which is to say, a lot. I think most other major countries in the world are set up to do about the same thing – cuts rates and spend a lot more money than they take in.
All of that to say, at this point, having 2026 be a hard down year, say -40% or more, would not be my base case. Even though this visual is a bit daunting-
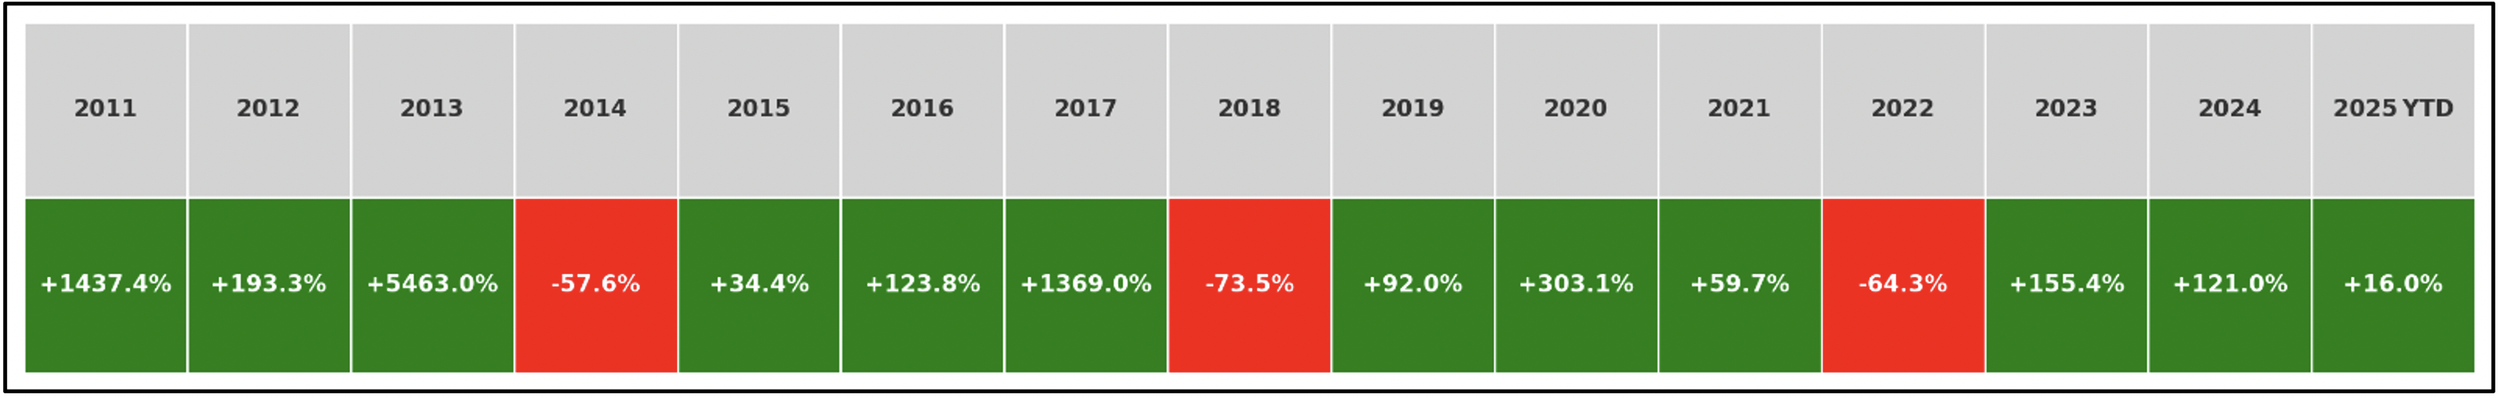
Maybe we end up with an overall weaker move to the upside for these “three up” but a less pronounced move to the downside on the “1 down”? That would make a lot of sense to me. In fact, it would be my base case.
Like I said, the whole “cycle” characterization doesn’t make all that much sense to me. On top of that, multicycle onchain metrics have lost a lot of their efficacy due to the ETFs, perps, CME futures, etc. But it can still be helpful to look at these onchain metrics and see if there’s anything worthwhile to glean from them.
First up is MVRV Z score –
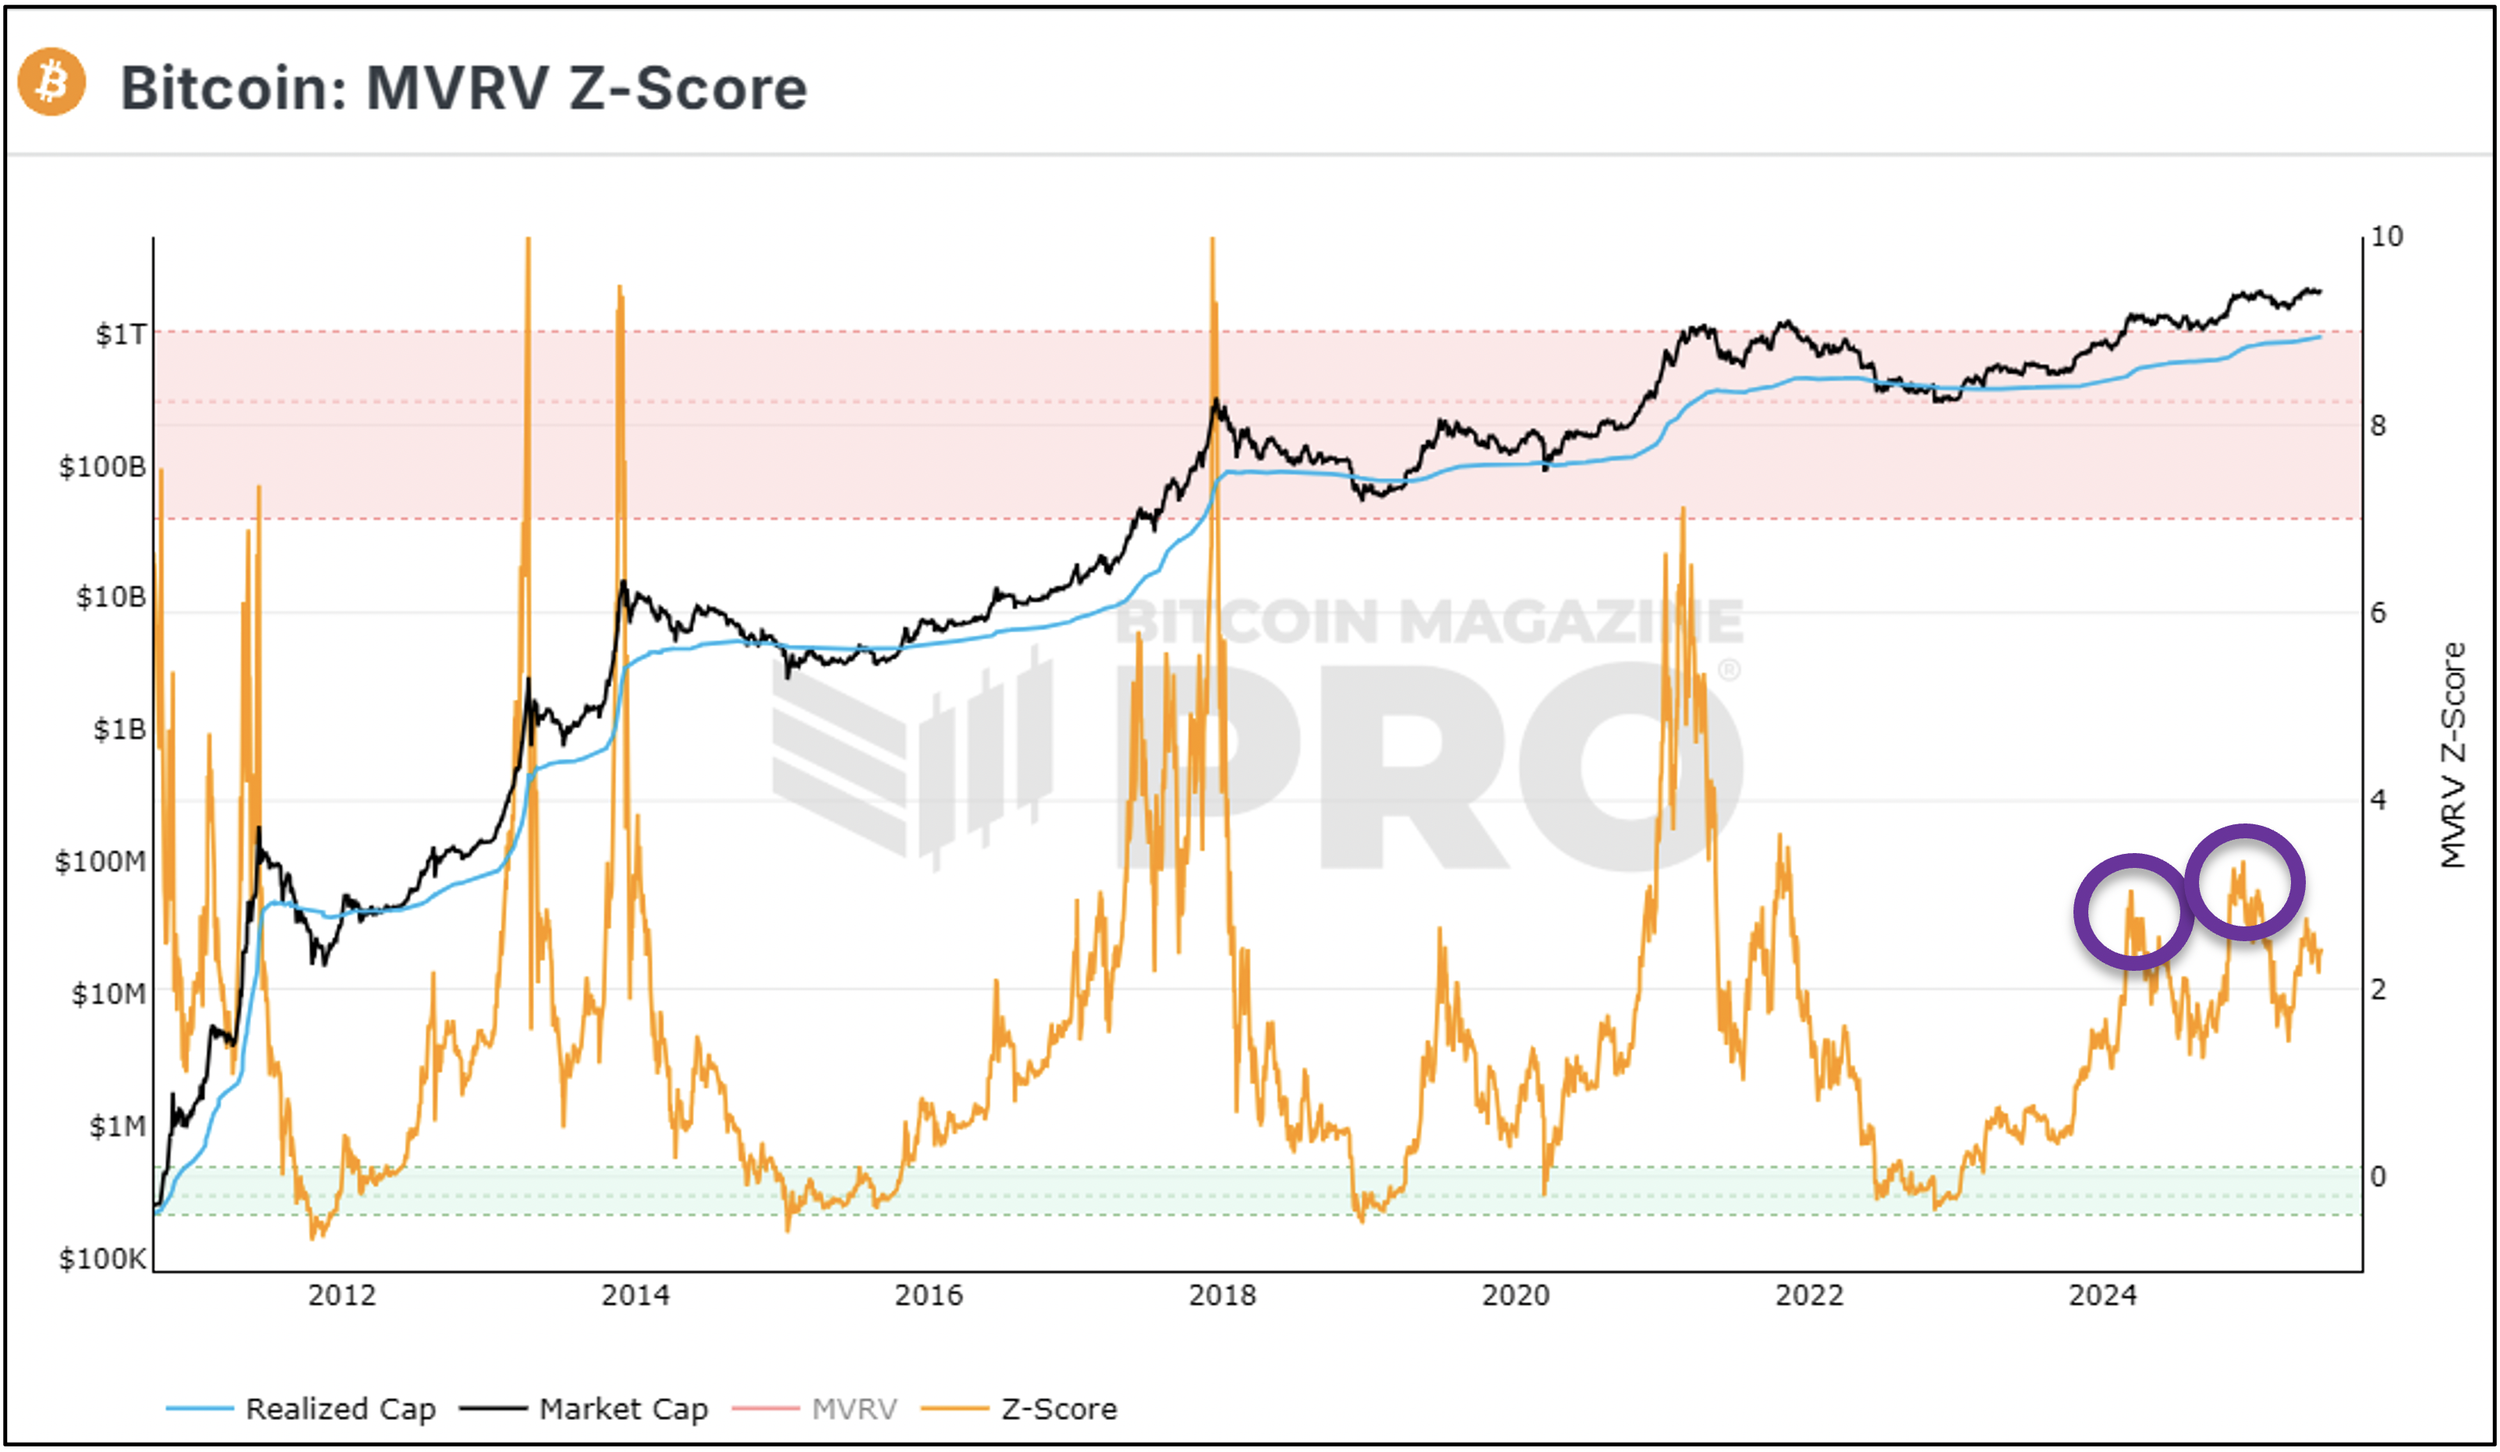
Source: Bitcoin Magazine. As of 6/30/25.
Note the purple circles. If BTC cycles were still going on, then we should see a big blowoff in MVRV, basically starting right now. I really struggle to see that materializing with the current set of facts we have. Obviously, all sorts of things could come out of nowhere that could drive BTC price much higher very quickly, but that wouldn’t be my base case.
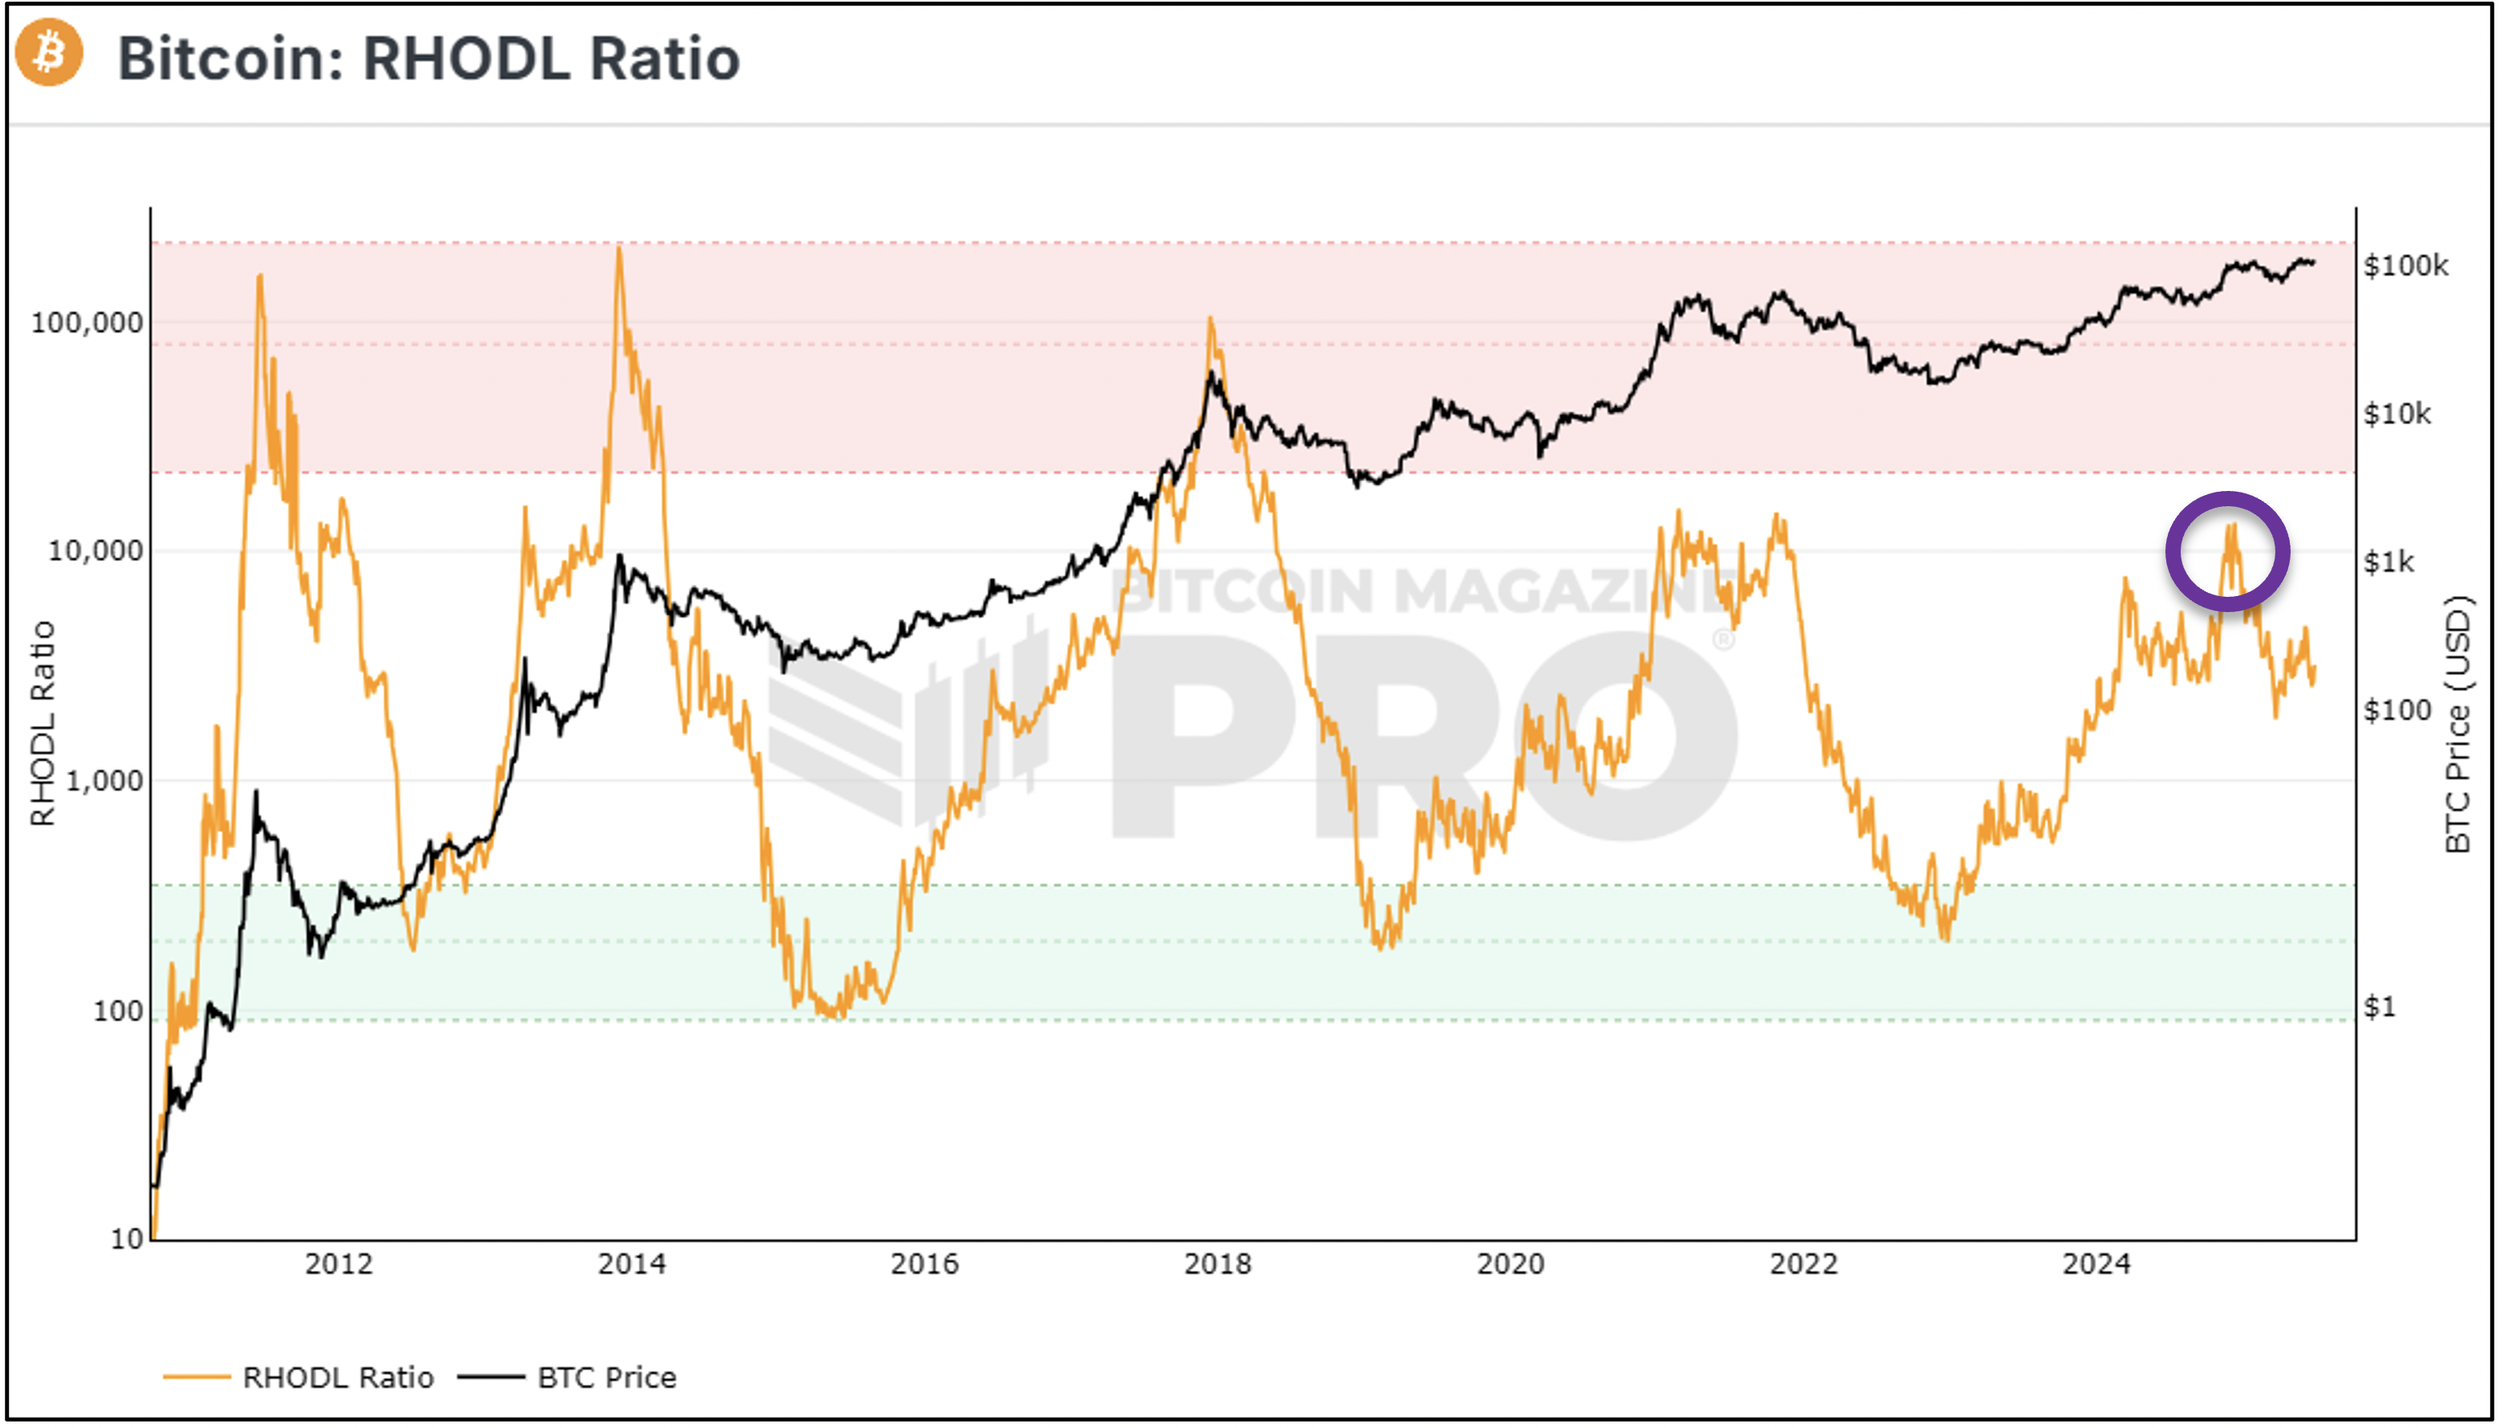
Source: Bitcoin Magazine. As of 6/30/25.
RHODL Ratio, which looks at the ratio between 1-week holders and 1-2 year holders, is a bit more alarming. In the Dec 2024 runup to $100k, RHODL did spike into the area where BTC price topped in 2021. That said, RHODL has pulled back a decent amount since then, and currently sits elevated but not super alarming. Again, I would not expect a blowoff in this metric. Could the pattern we’ve seen YTD in RHODL be a multiyear topping pattern, akin to 2021? Yeah maybe. But my base case would be that over the next 6 quarters, that orange line shown above will put in a pattern we haven’t seen on the chart before. My base case would be that it chops in the white part of the chart through 2026, not reaching the red or green areas.
Here's another nice chart that shows a bracketed price target range based on several cyclical indicators-
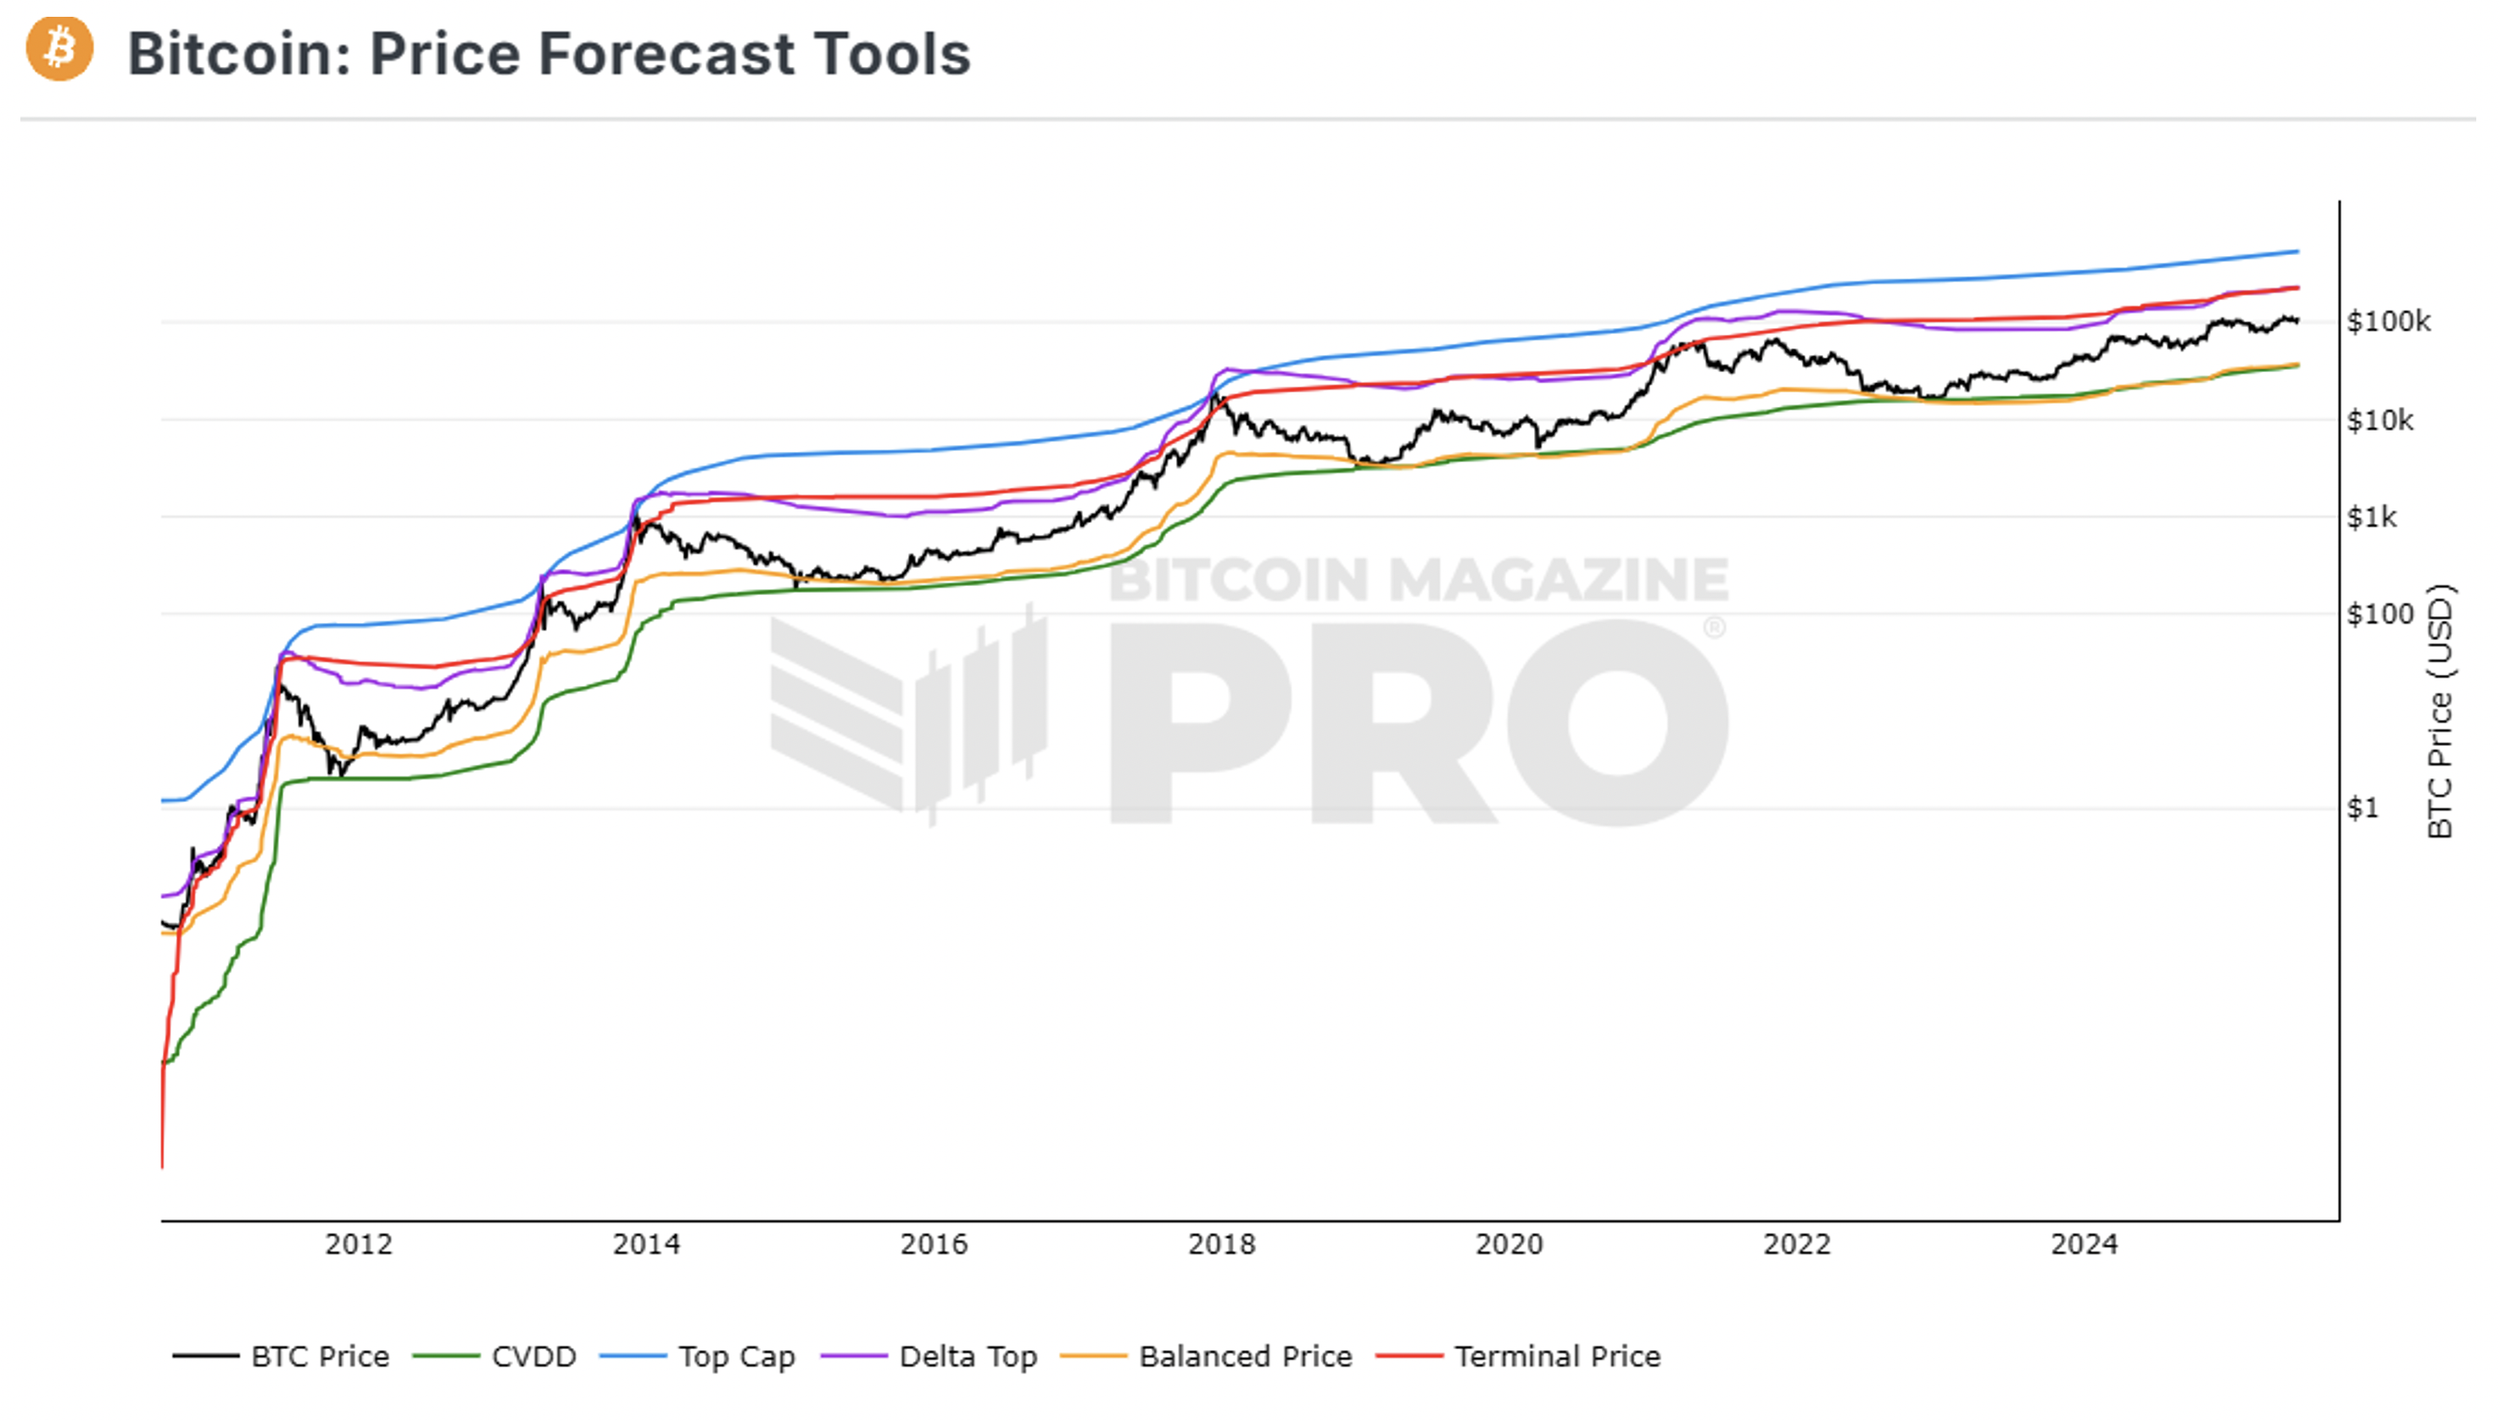
Source: Bitcoin Magazine. As of 6/30/25.
It drives home the point of where price is at the moment – firmly in the middle of a generational bottom and a sell everything top. And not particularly close to either one for that matter. That red line on the top? The one that BTC price has grinded up against leading up to every historical top? That’s at $200k at the moment. It would not be my base case we see $200k prior to 2027 at the earliest. So I think this chart, like many of these onchain charts, is probably about to put in a pattern it’s never done before.
Last chart for BTC. This one was pretty shocking to me –

Source: Bloomberg. As of 6/29/25.
This is the ratio of IBIT’s 60-day realized vol to SPX’s 60-day realized vol. So it’s a measure of relative volatility between BTC and stocks. Really incredible chart TBH. A year ago, IBIT was 5.7x more volatile than the SPX. Today, it is 1.3x more volatile. That is, uhh, significant.
This is something Bitcoiners have been talking about for at least a decade. BTC was always seen as too small and too volatile to actually contend for world reserve currency status, or preferred store of value status. The general view for years has been that BTC’s market cap would get much bigger, and with it, the price volatility would decline. Eventually, the price volatility would settle into a range that would be more palatable for long-term, risk averse holders. Something more akin to other asset classes. Well. Thanks to the ETFs. And thanks to options (and the tremendous magnitude of call overwriting that has been occurring). You are now getting into that range of price volatility. It’s a significant change in BTC price discovery. Our little magic internet money has grown up.
Moving away from BTC, the chart below is a perfect visual to show how unique Q2-25 was-
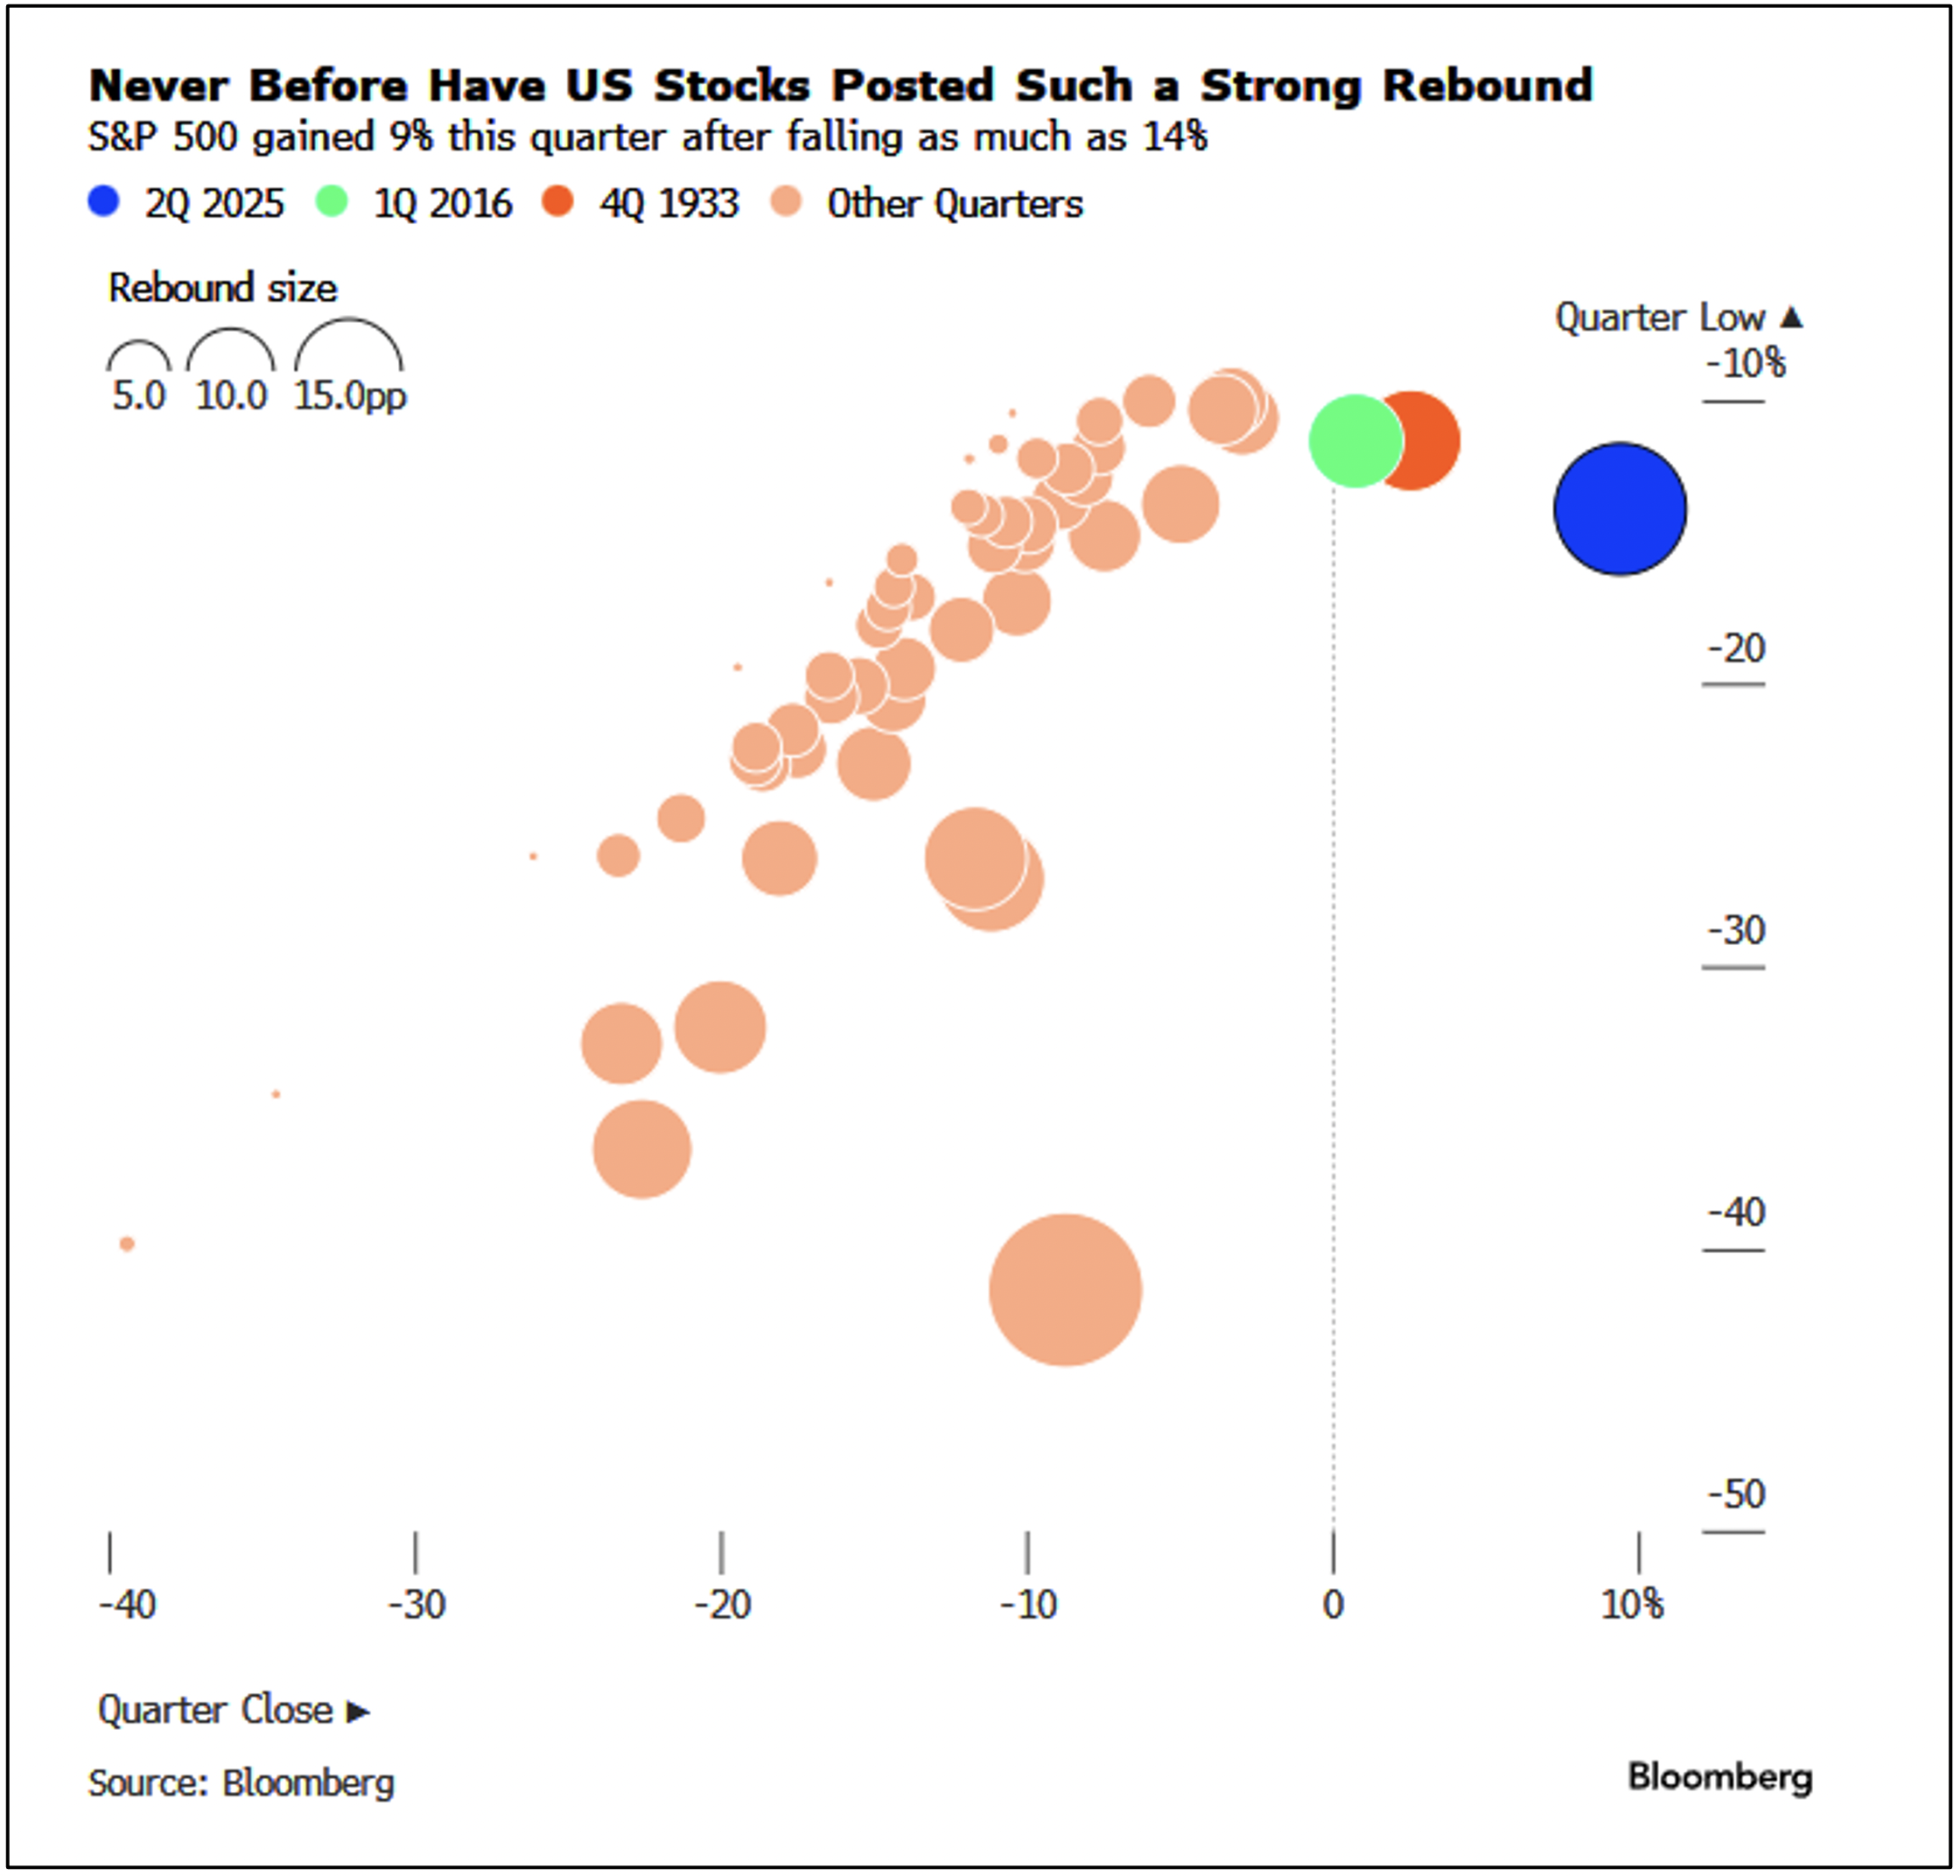
You’ve never had the SPX decline so much in a single quarter and finish the quarter so positive. Not even close. All courtesy of tariffs and Panicans.
This chart of the DXY caught my eye –
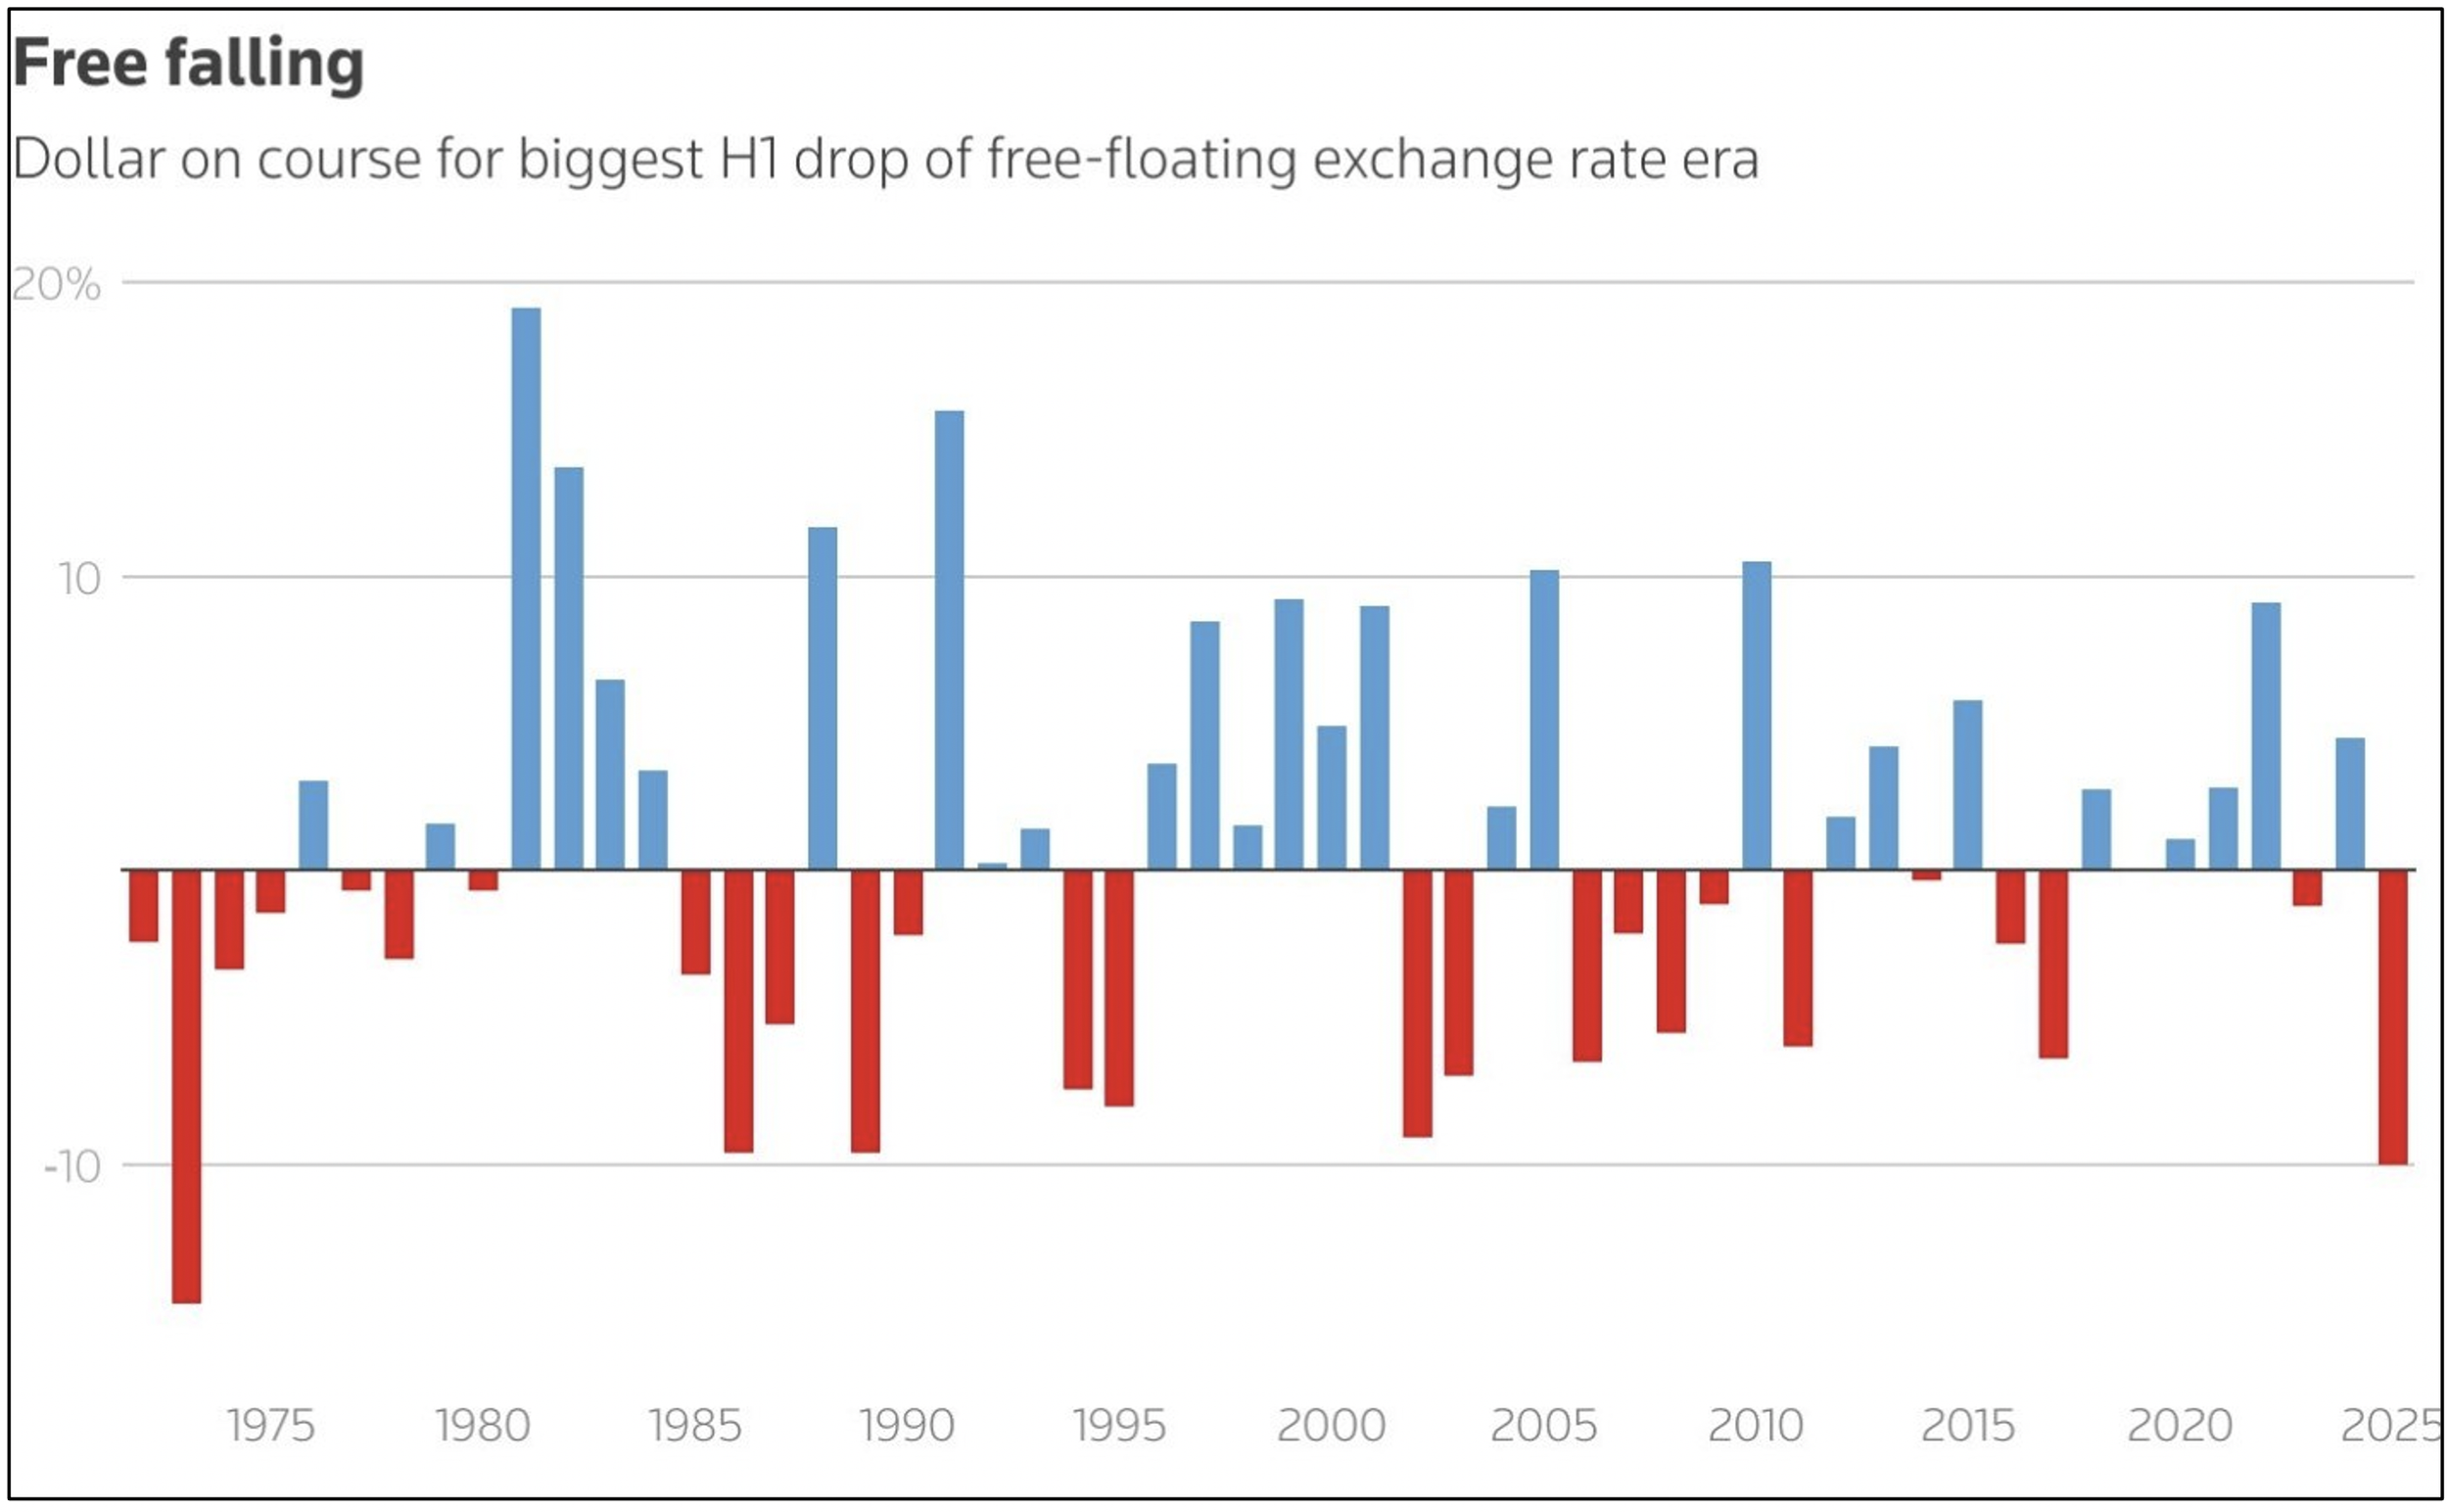
Largest 1H decline in the DXY since 1973. Whoah. The multidecade DXY chart looks like this-

Source: Tradingview. As of 6/30/25.
That’s been a one-way train since the start of the year. Trump wants it lower. My guess is he’ll get it. That should be supportive for crypto in general.
In the very near-term, this one caught my eye. Extremely strong seasonality for stonks in July. That should be supportive for crypto in general.
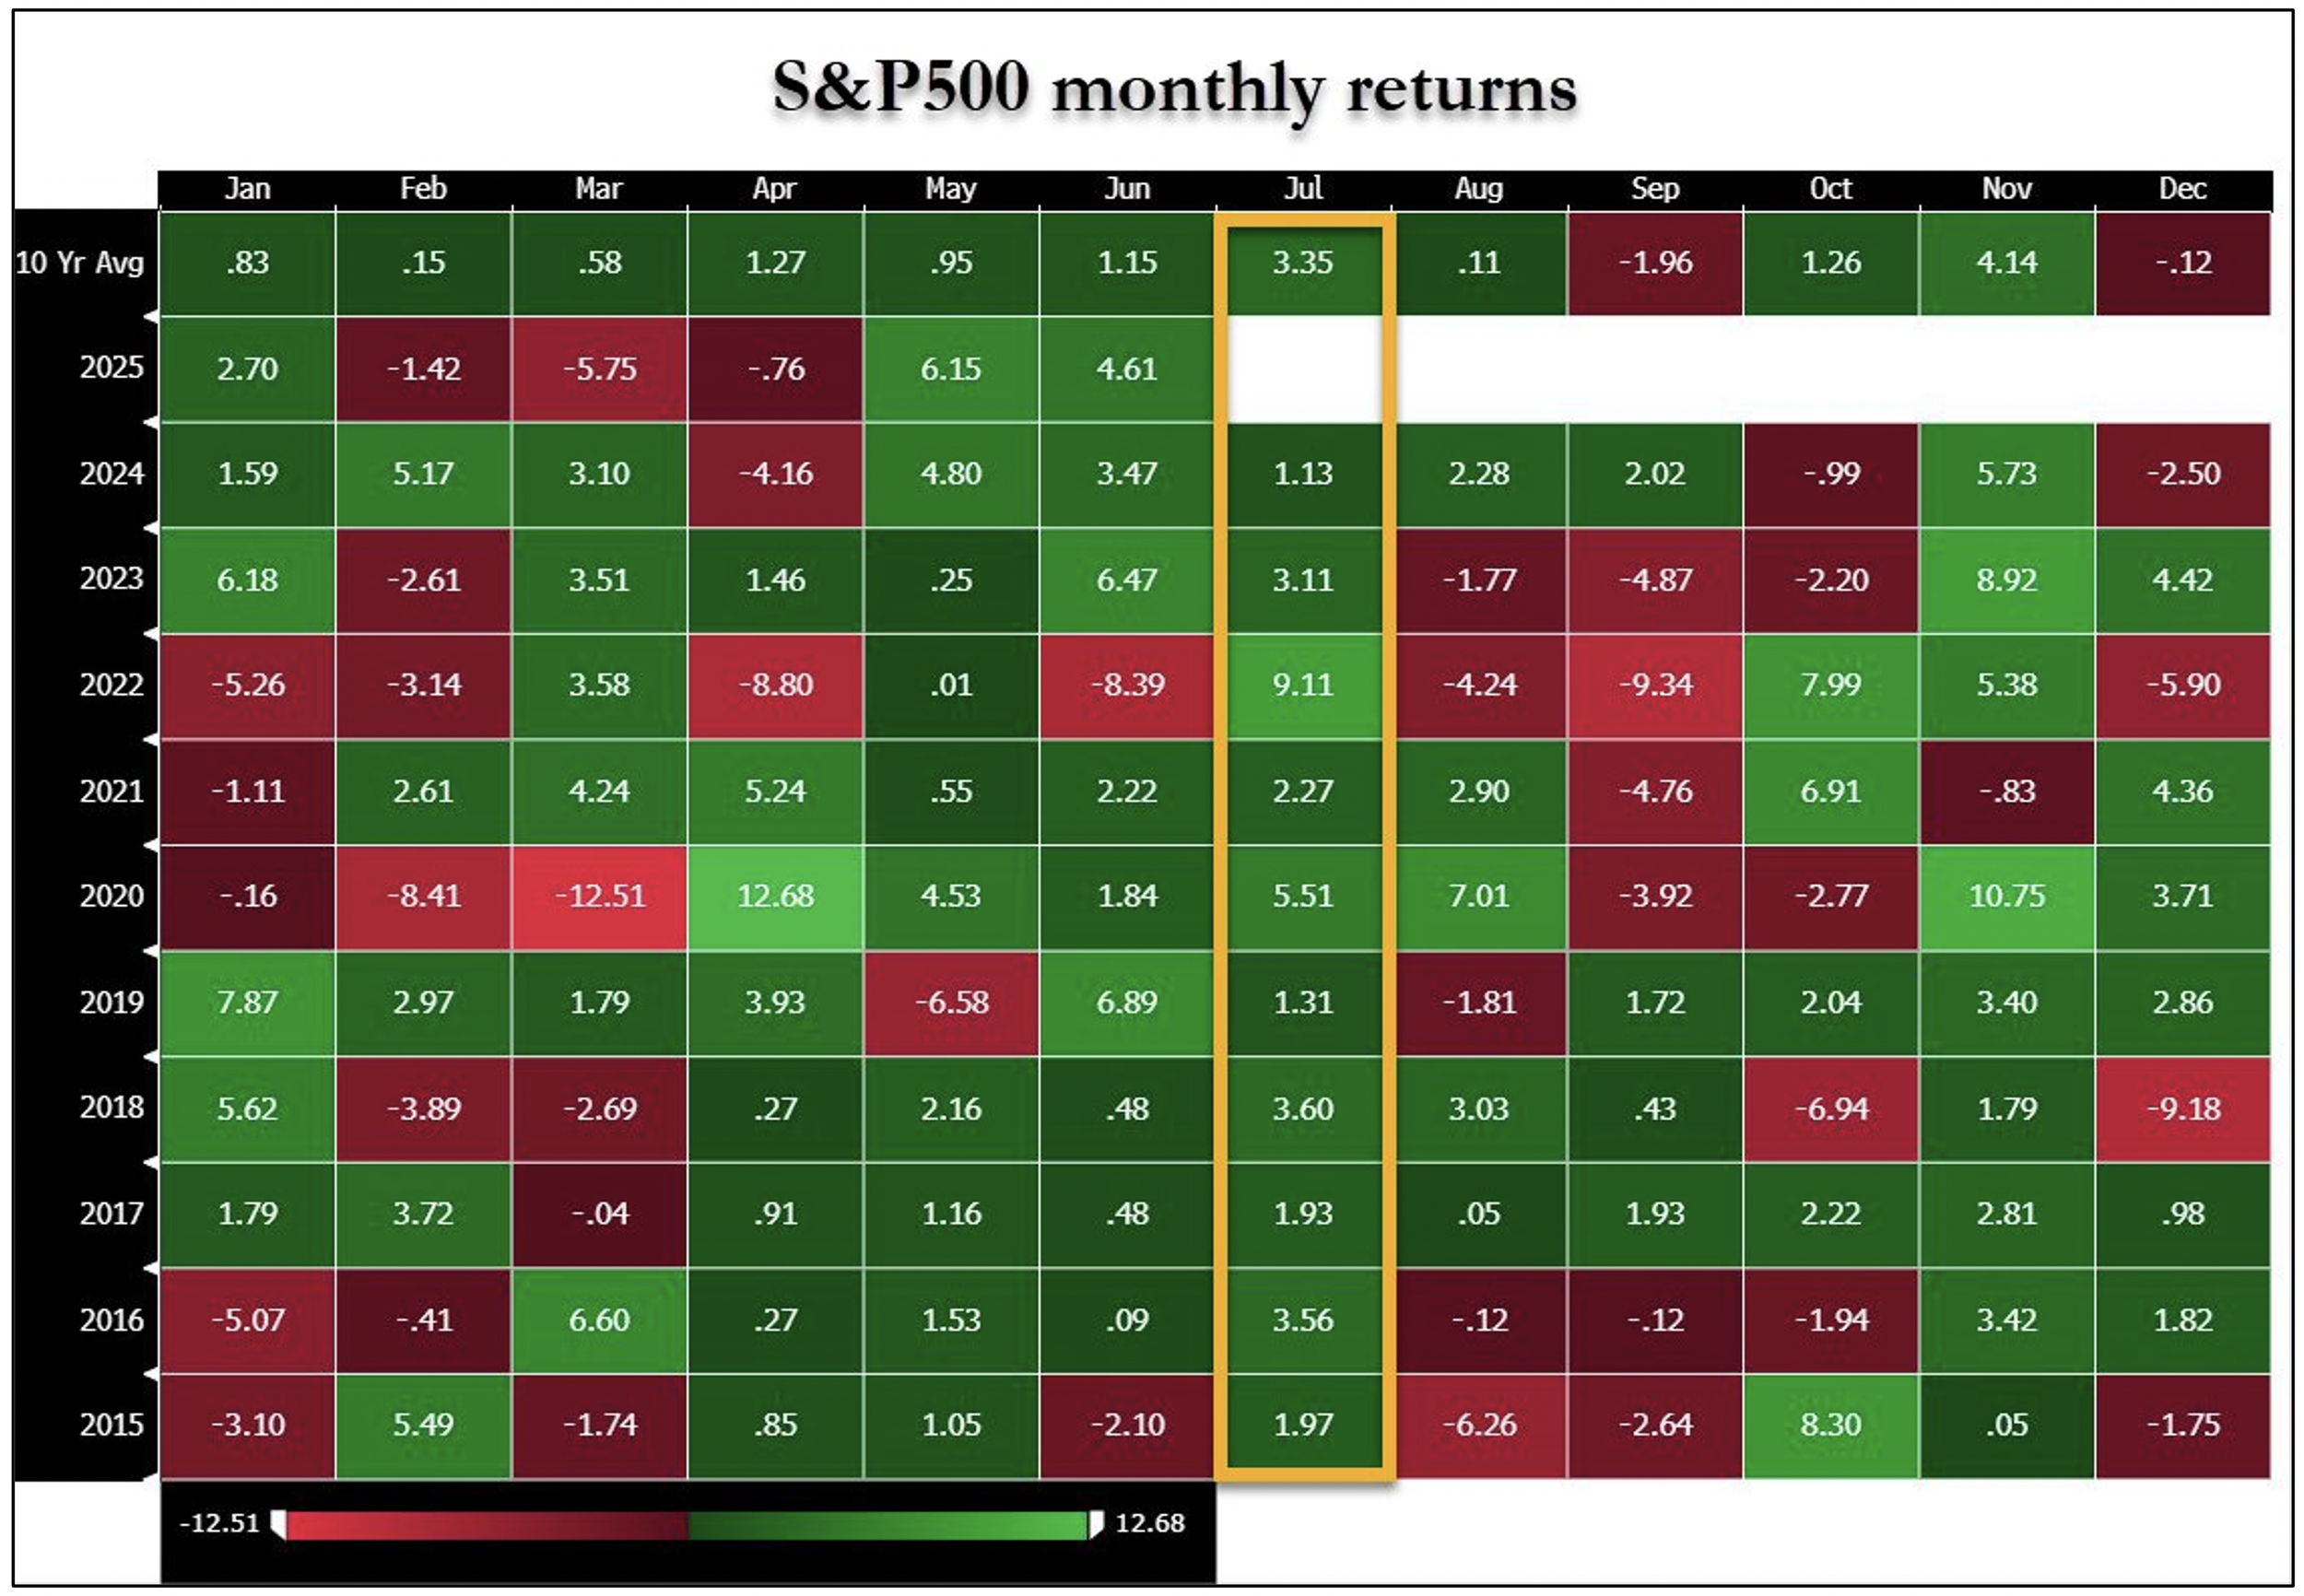
Source: @zerohedge. As of 6/30/25.
Last chart. This is central bank net purchases of gold since WW2-
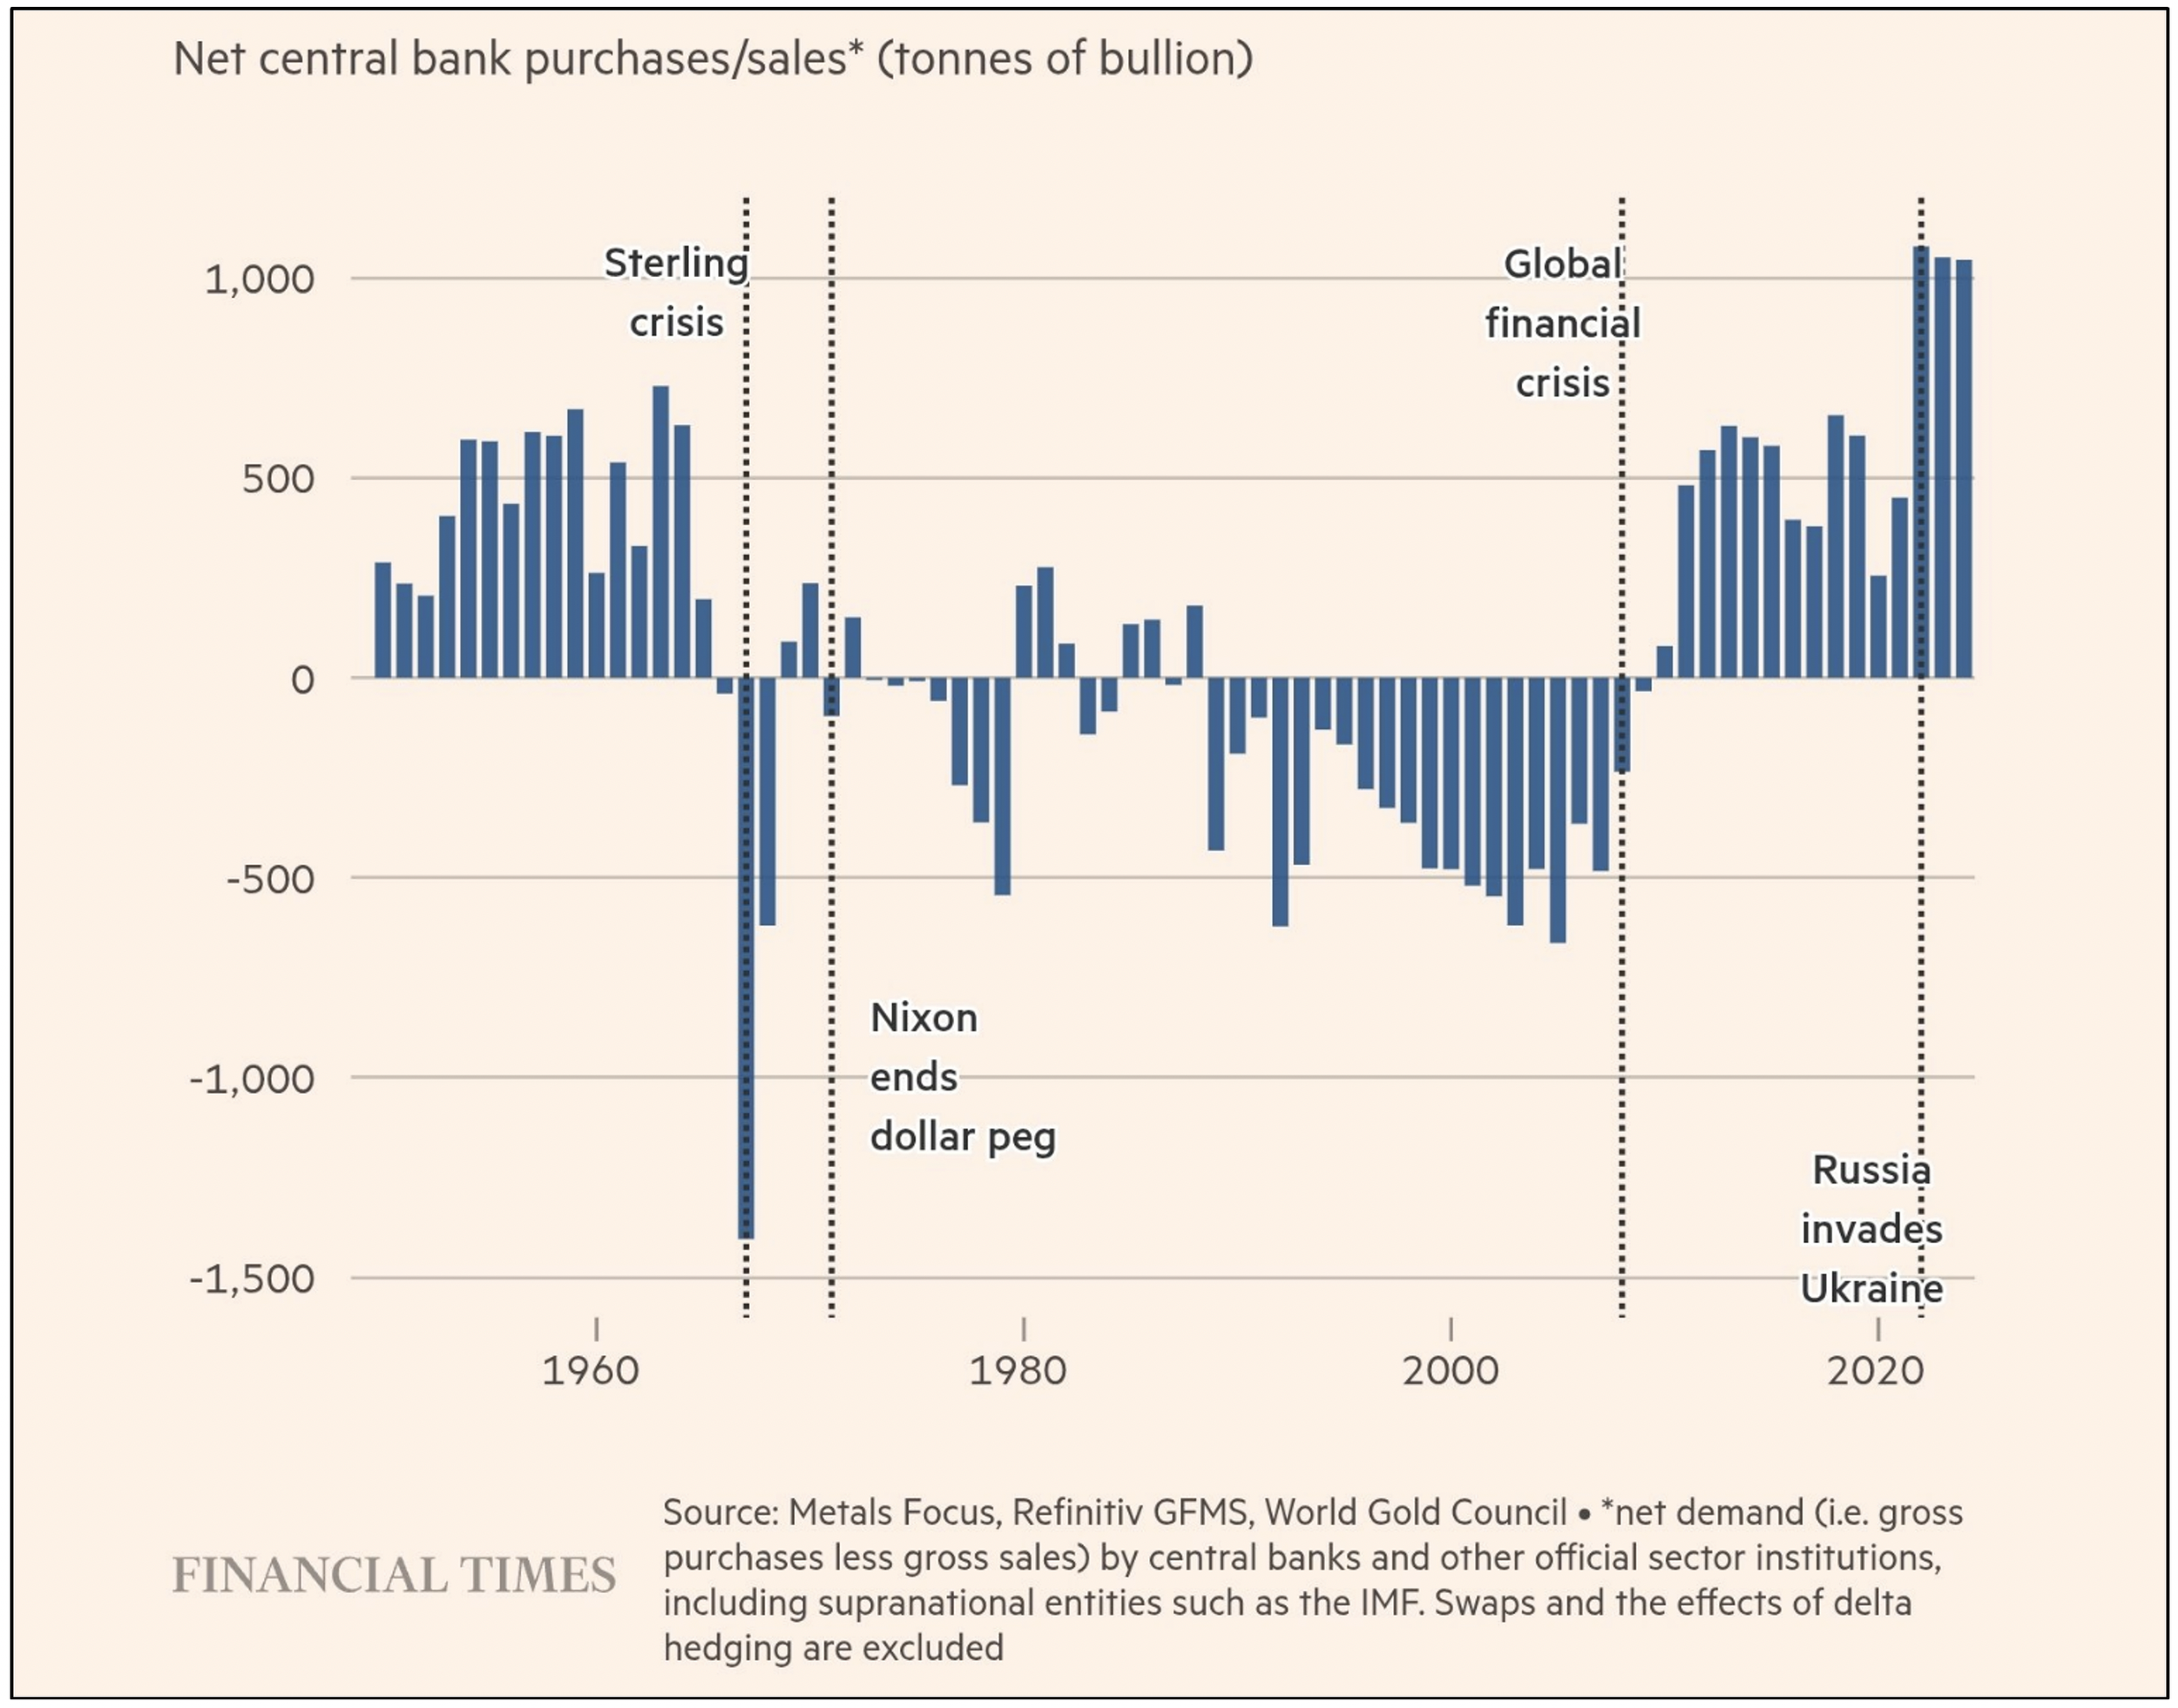
The chart drives home some major points. First, everything really did change after the financial crisis. The world was QUITE comfy storing value in dollars and Treasuries until the US started bailing out banks and printing money in serious size out of thin air. The US response to the GFC made the world rethink its exposure to gold relative to dollars and Treasuries. Second, things changed again when Russia attacked Ukraine and the US froze Russia’s gold (to the tune of $300bn) and Russia’s access to the dollar. That made the world rethink its exposure to gold further still. This trend strikes me as supportive for BTC.
I’m going to skip the Alt charts this month. There’s really not much to talk about. Prices were mostly flattish. There’s nothing going on in Alts. We’ll check back in in August. You’re not missing anything.
Closing Remarks
My guess is if you’re reading this, you’ve heard the name Zohran Mamdani a decent amount in the last couple weeks. In case the Ikigai Monthly Market Update is literally the only news you consume, Zohran is currently a representative in the NY state assembly, and he is running for mayor of New York City. He is a 33 year-old Muslim socialist. His entire campaign platform is based on socialist ideals. He wants free childcare, free buses, rent freezes and government-run grocery stores. And he wants to fund all that by taxing the wealthy.
None of this would be too alarming, except he beat Andrew Cuomo in the Democratic primary and is now the presumptive Democratic nominee against Eric Adams. Even that might not be too concerning, except Zohran appears to have a very good shot at winning the mayoral election in November, 70% odds per Polymarket-

Source: POlymarket. As of 7/1/25.
Political pundits have marveled at Zohran’s “ground game”. He got 385,000 New Yorkers to turn out for early voting, 200,000 more people than 2021. He got endorsements from AOC and Bernie. He’s been highly adept at utilizing social media. It’s clear his message is resonating with many New Yorkers, in particular young voters.
This response for the voting public of NYC, while misguided, is totally rational in my view. The wealth inequality in NYC is among the highest in the US and the highest in the world. There are few other places on Earth where so much wealth is concentrated in the hands of so few. New Yorkers’ support for socialist ideals is in direct response to that staggering wealth inequality. When so few have so much compared to the large majority who have relatively so little, calls for socialist policies is a natural response.
We’ll see what happens in the NYC mayoral election in November. 70c on Polymarket feels rich to me, but this is admittedly well outside my wheelhouse. Regardless of the election outcome, I’m fairly certain we’re going to see more of this sort of thing in the coming years. You already have a number of cities in America running some version of “socialist-lite” policies – Chicago, Boston, St. Louis, St. Paul. I don’t get the sense these experiments are going particularly well, but the people voted for them and it seems like they’ll keep voting for them.
The main driver of my view that we will see increased socialist experiments in America is that it really seems like wealth inequality is set to continue increasing in America. AI and robotics, which will likely dominate economic growth in the years to come, are strong drivers of wealth inequality. Most of the value created from these technologies will accrue to about a dozen companies. These companies will need increasingly fewer humans to run their business, as AI and robotics take those jobs for humans. And so the trillions of dollars of value created from these technologies will flow to less and less people. NVDA is the perfect example. The average net worth of an NVDA employee is estimated to be $5-8mm. Think of that example as a blanket concept for how wealth will accrue in the coming years.
I am a fan of Democracy and a fan of free-market capitalism, but it is obvious to me that the level of wealth inequality we have in the US is untenable. And to the extent wealth inequality gets worse (which I think it will), then the situation will get increasingly more untenable. Something eventually has to give. I think the endgame has to be UBI. I’ve felt this way for years. I realize that “every technological innovation in history has created more jobs than it destroyed”, but I do think this time is different with AI and robotics. But what is the path from where we are today to that eventual UBI outcome? How much social unrest do we get between now and then? And what is the ideal version of UBI to eventually implement?
My main struggle in this line of thinking is the undeniable fact that governments are basically the worst at everything they try. The amount of waste and inefficiency and inefficacy of government is sky high. We have to have government, but they are the definition of a necessary evil. I couple this with the fact that American politics and The Swamp have become so disgusting, that the best and the brightest, the people you’d actually WANT to run for office, overwhelmingly have NO desire to do so. And the people that ARE attracted to running for office, by and large are NOT the people you want doing the job.
So the idea that you’re going to take increasingly more money out of the pockets of America and give it to the government, which is often made up of people you really don’t want to be charge, and then put them in charge of the redistribution of that money for the betterment of all Americans – that strikes as an idea with a lot of holes in it.
But if no one comes up with a better idea in the interim, it looks like that will be the playbook that gets implemented. NYC may be about to do a test run for it. Should be a boon for the Miami real estate market.
"Gold coins to a cat."
-Japanese Proverb
Travis Kling
Founder & Chief Investment Officer
Ikigai Asset Management
1. Ikigai Asset Management is the trade name for a collection of advisory and consulting businesses operated by Travis Kling, Anthony Emtman, and their team.
The information contained or attached herein is not intended to provide, and should not be relied upon for, accounting, legal or tax advice or investment recommendations. This presentation may contain forward-looking statements that are within the meaning of Section 27A of the Securities Act of 1933 and Section 21E of the Securities Exchange Act of 1934. These forward-looking statements are based on management’s beliefs, as well as assumptions made by, and information currently available to, management. Although management believes that the expectations reflected in these forward-looking statements are reasonable, it can give no assurance that these expectations will prove to be correct. This email is for informational purposes only and does not constitute an offer to sell, or the solicitation of an offer to buy, any security, product, service of Ikigai as well as any Ikigai fund, whether an existing or contemplated fund, for which an offer can be made only by such fund’s Confidential Private Placement Memorandum and in compliance with applicable law. Past performance is not indicative nor a guarantee of future returns. Please consult your own independent advisors. All information is intended only for the named recipient(s) above and is covered by the Electronic Communications Privacy Act 18 U.S.C. Section 2510-2521. This email is confidential and may contain information that is privileged or exempt from disclosure under applicable law. If you have received this message in error please immediately notify the sender by return email and delete this email message from your computer. Copyright 2023 Ikigai Asset Management, LLC. All Rights Reserved.
NOT INVESTMENT ADVICE; FOR INFORMATION ONLY
PAST PERFORMANCE IS NOT A GUARANTEE OF FUTURE RESULTS
